Welcome to Engaging Data
This is a virtual workshop / gallery where I post data visualizations, calculators, maps and other web programming projects. It covers a wide range of visualization styles and topics: whatever interests me at the time and I feel compelled to explore. Check out the tabs below to see visualizations in different categories. On mobile, scroll to the right to see more category tabs.
If you are an educator using any of these tools/visualizations in an educational setting, I’d love to hear how you are incorporating it into your curriculum, either in the comments or on twitter or via email.
Popular / FeaturedMapsEnvironmentEnergyFinancialPolitics/SocietyHealthFunMath/ScienceOther Dataviz
These are popular and featured projects
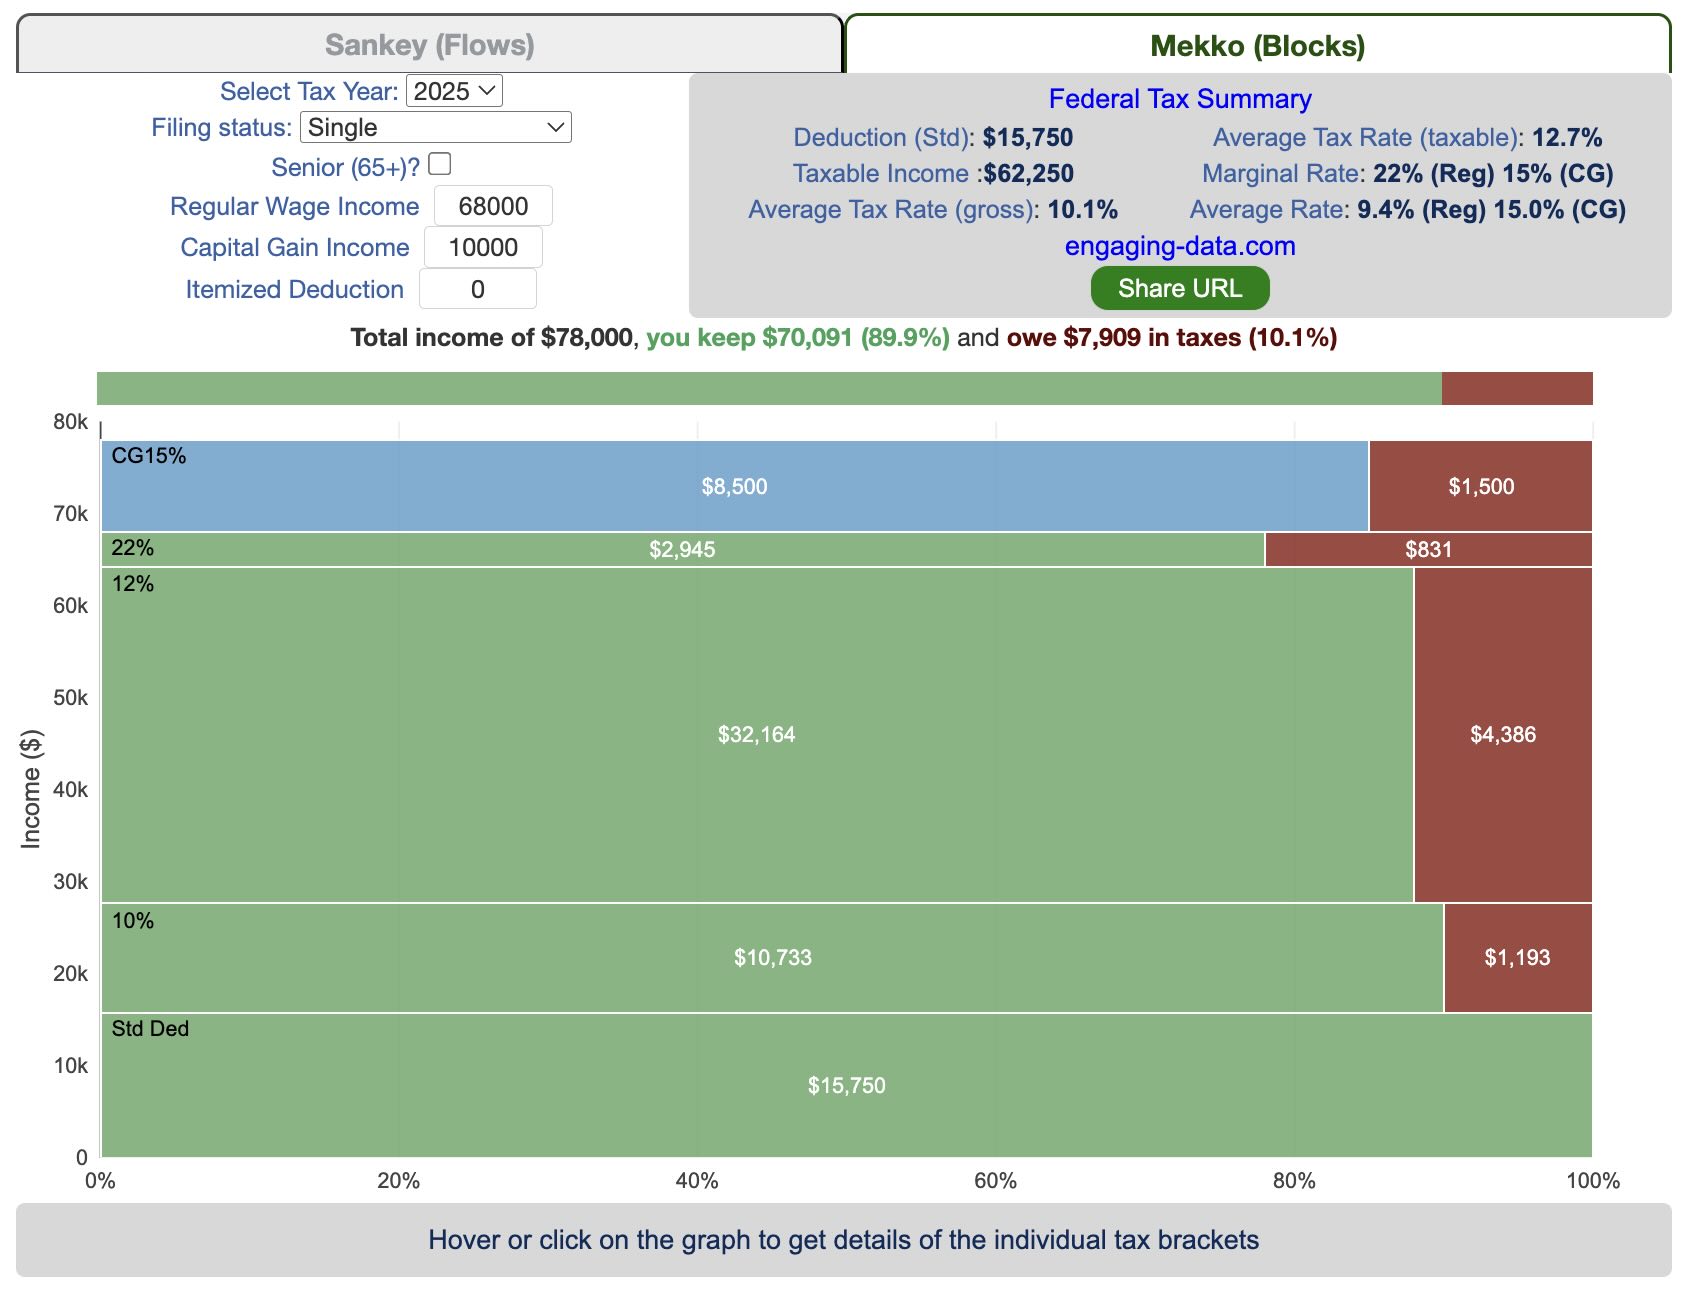
Income Tax Bracket Visualizer (NEW!)
California is fourth largest economy
Snake on a Globe
Univ. of California Admissions Rates by Campus and Major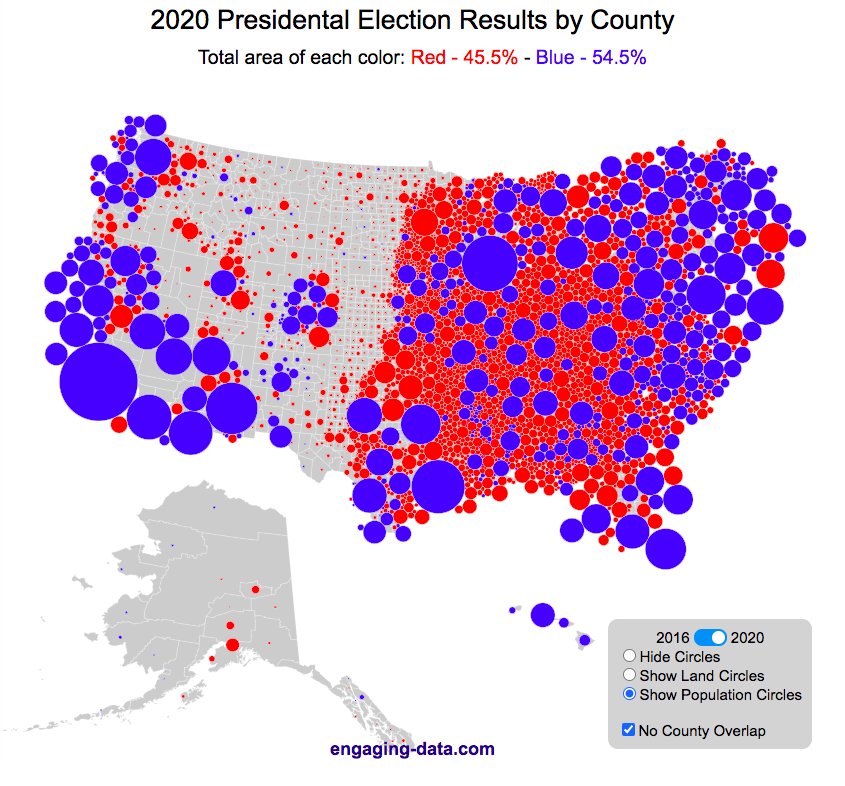
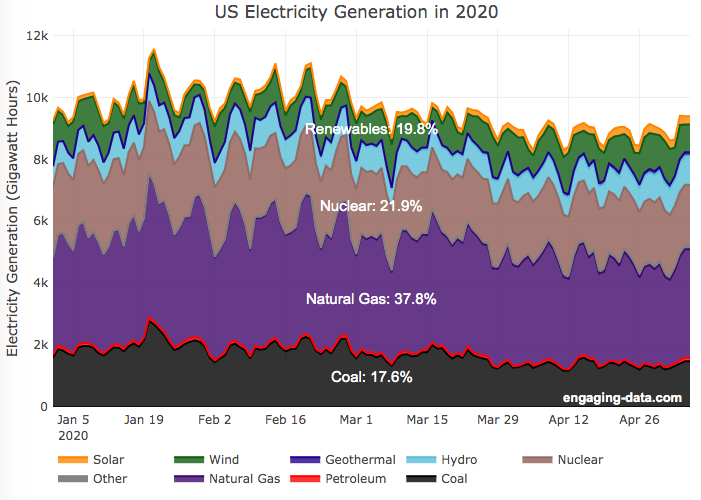
County Electoral Map – Land Area vs Population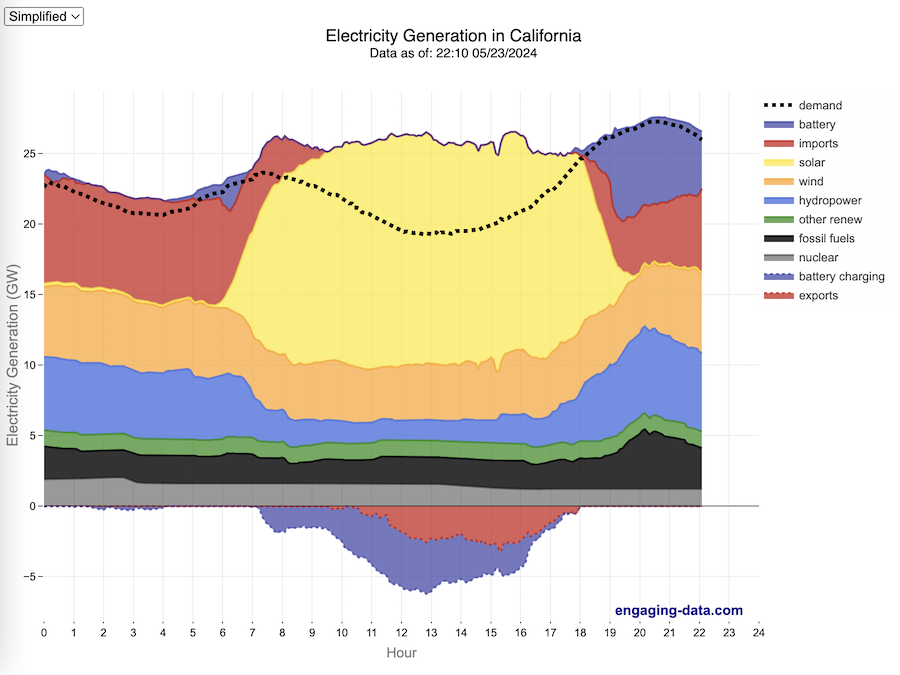 California Electricity Generation
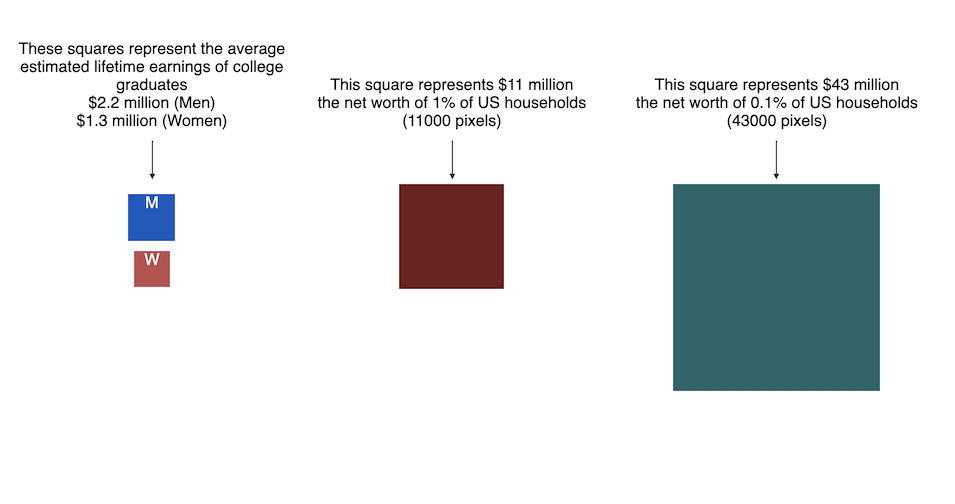 How Rich is Elon Musk? shown in pixels
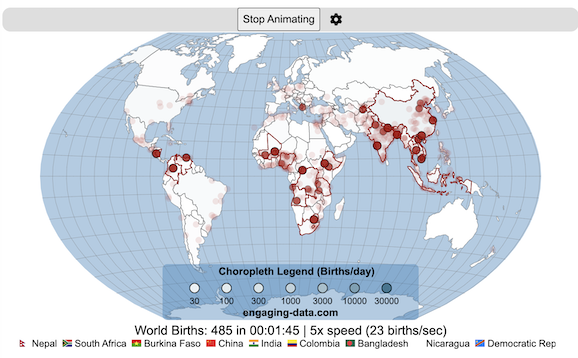 Global Birth Map
Stylish Text Font Generator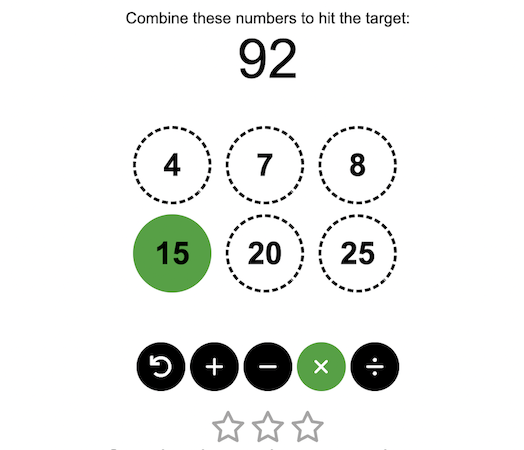
Digits Math Game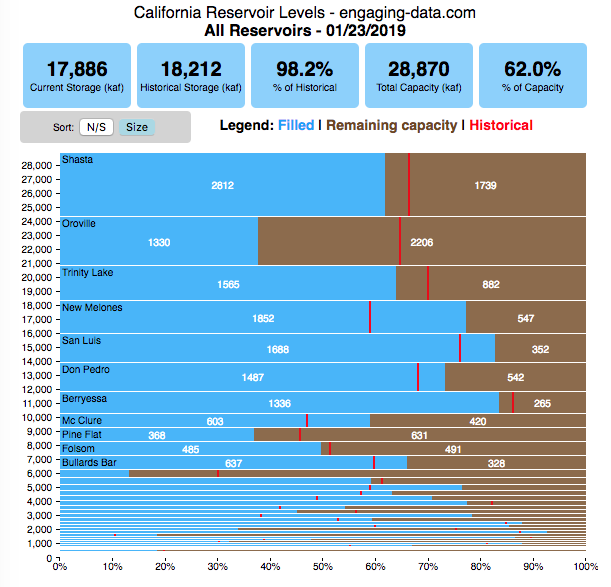
California Reservoir Dashboard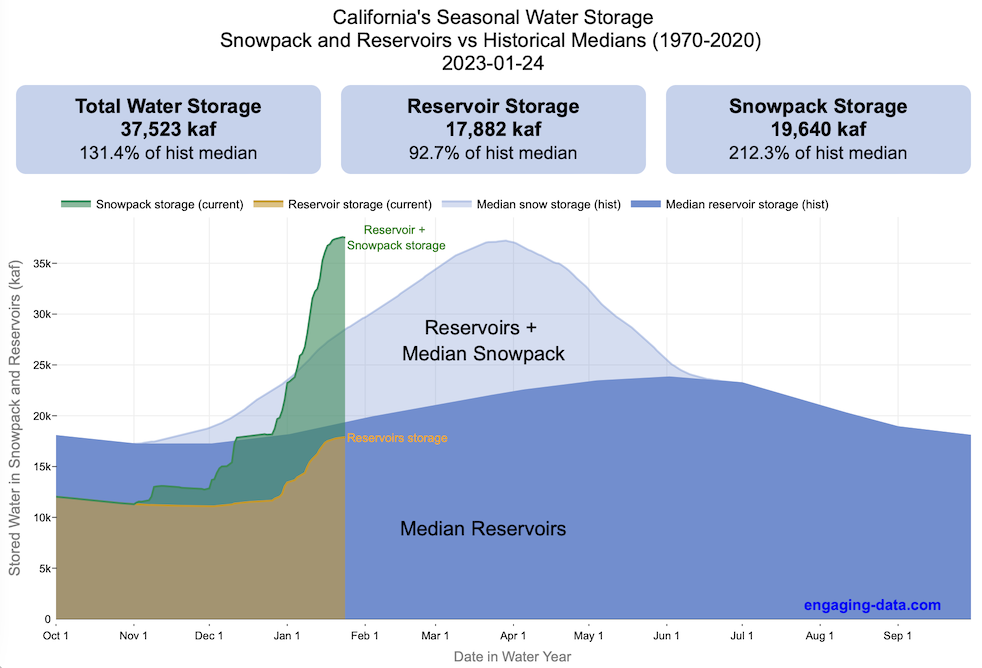
California Reservoirs and Snowpack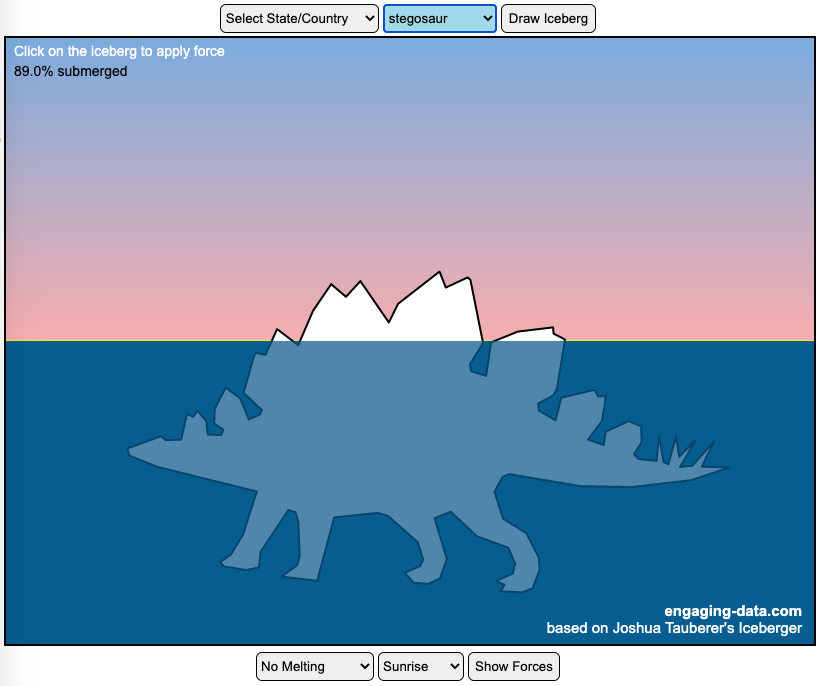
Iceberg Simulator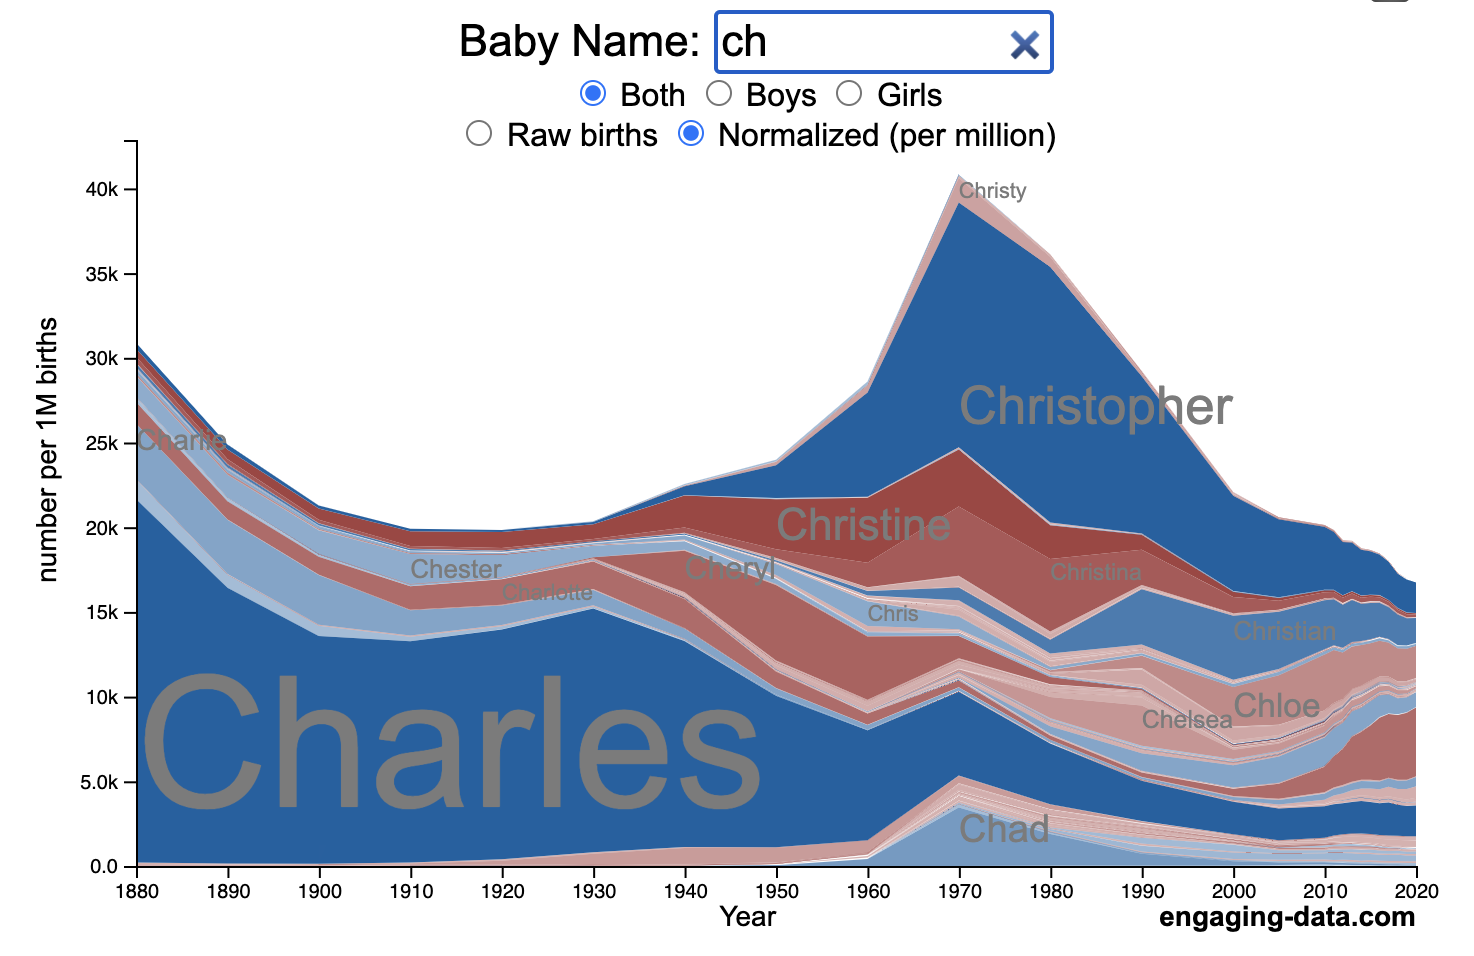 Baby name popularity visualizer
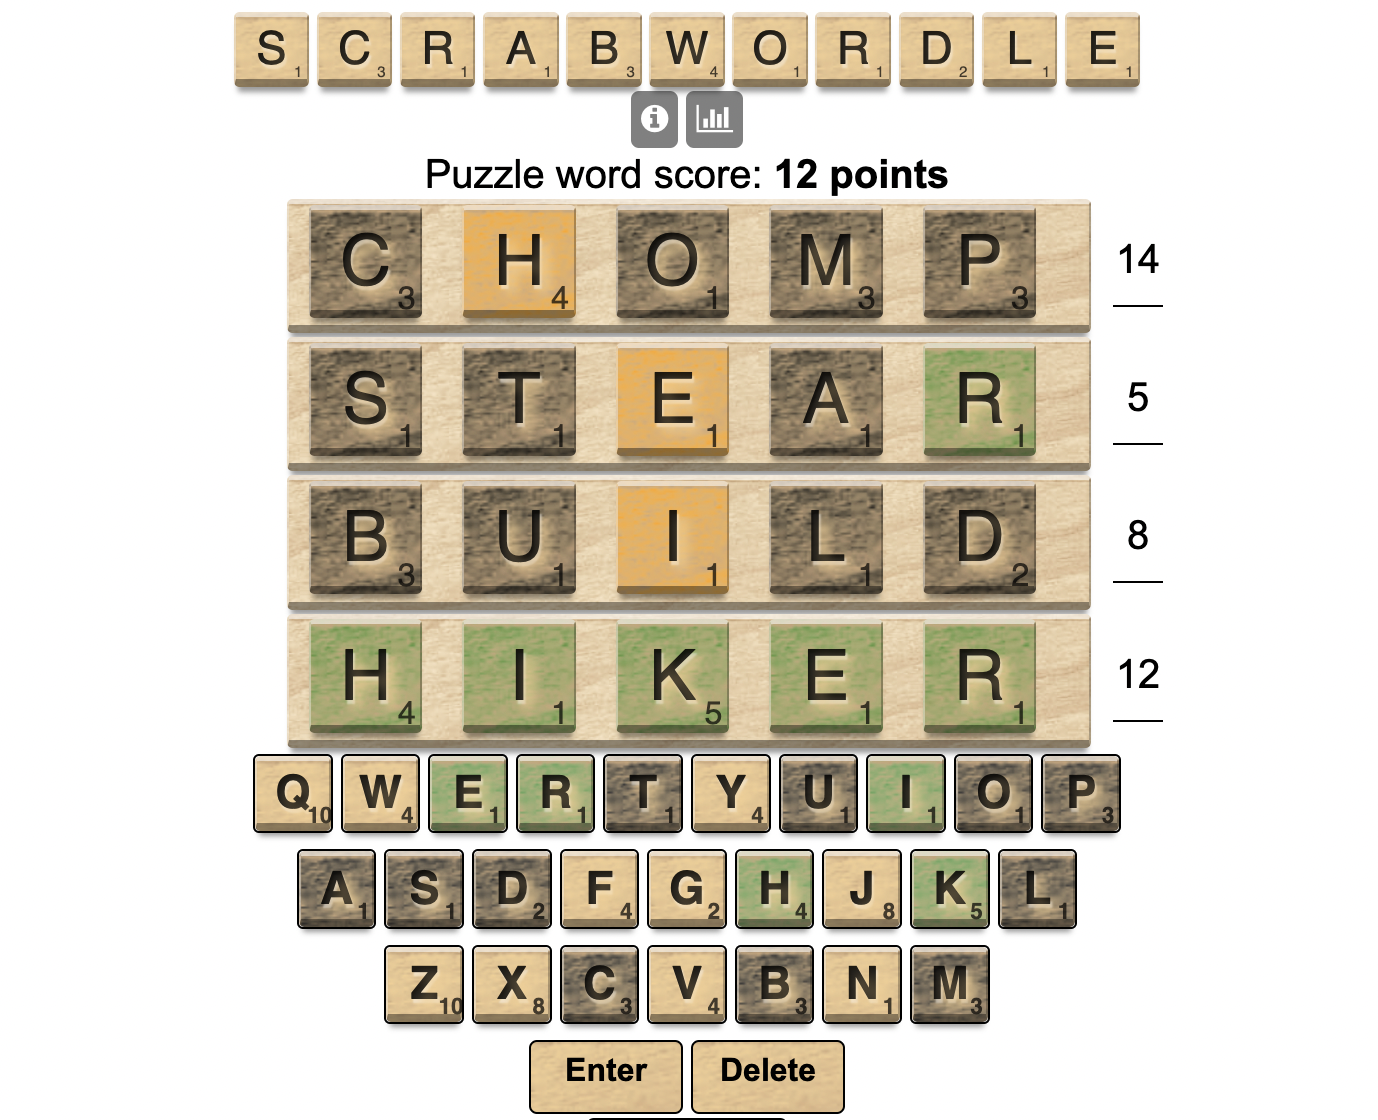
ScrabWordle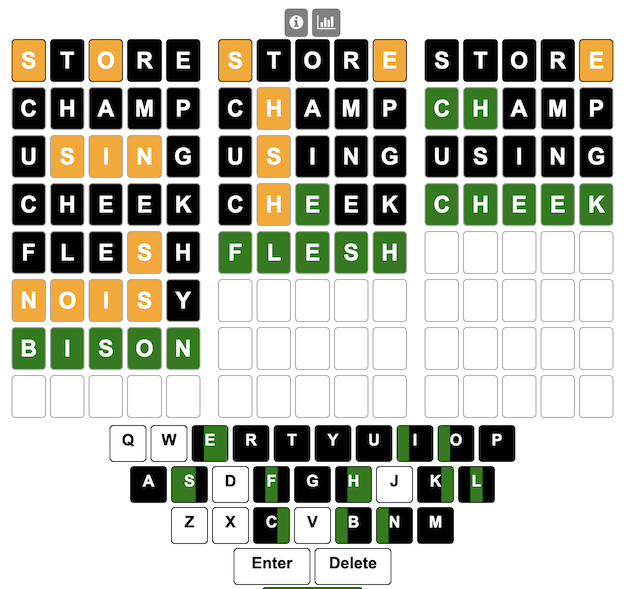
Tridle – Triple Wordle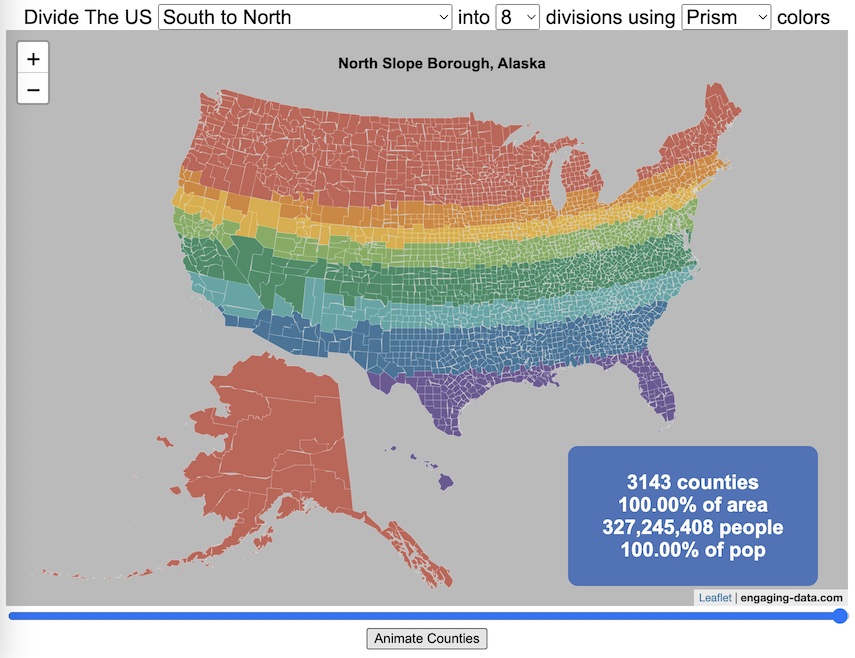 Splitting the US by Population
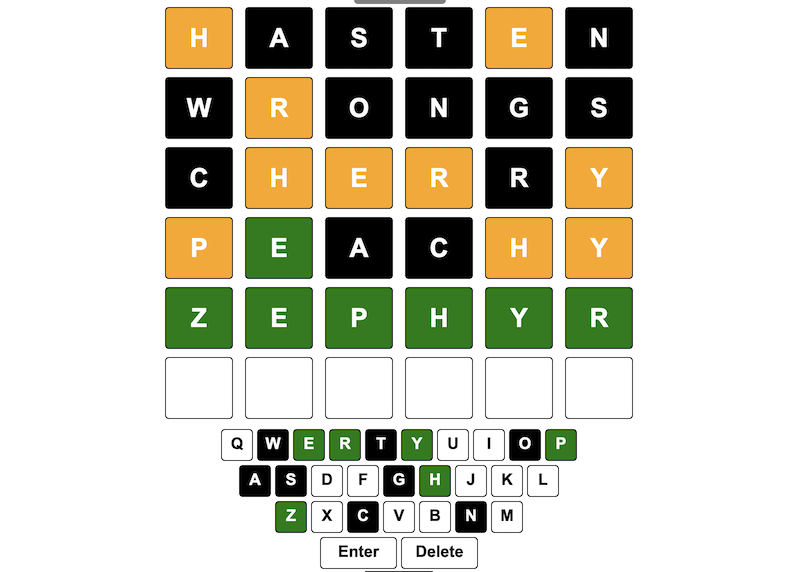 WordGuessr Wordle clone
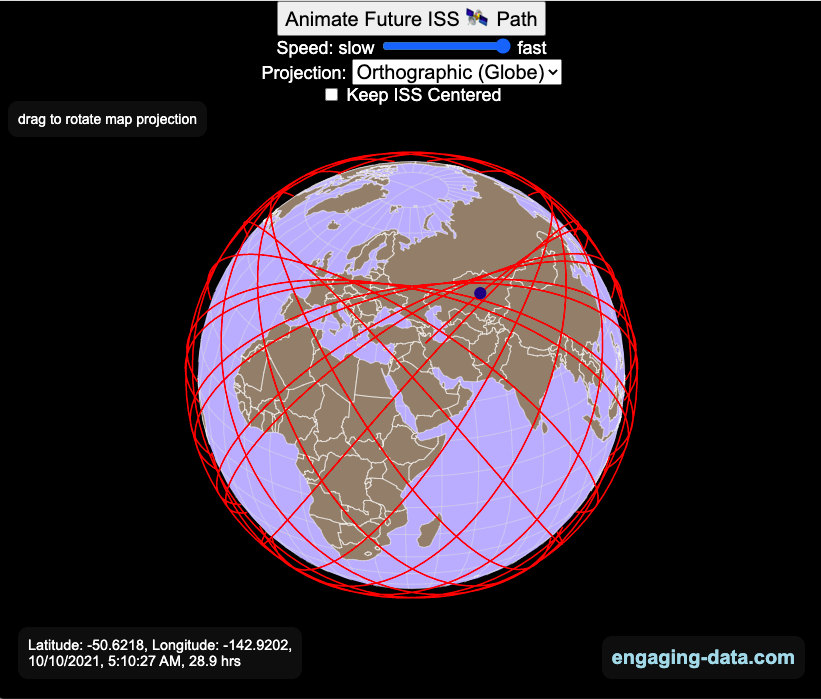
Orbital Pattern of the International Space Station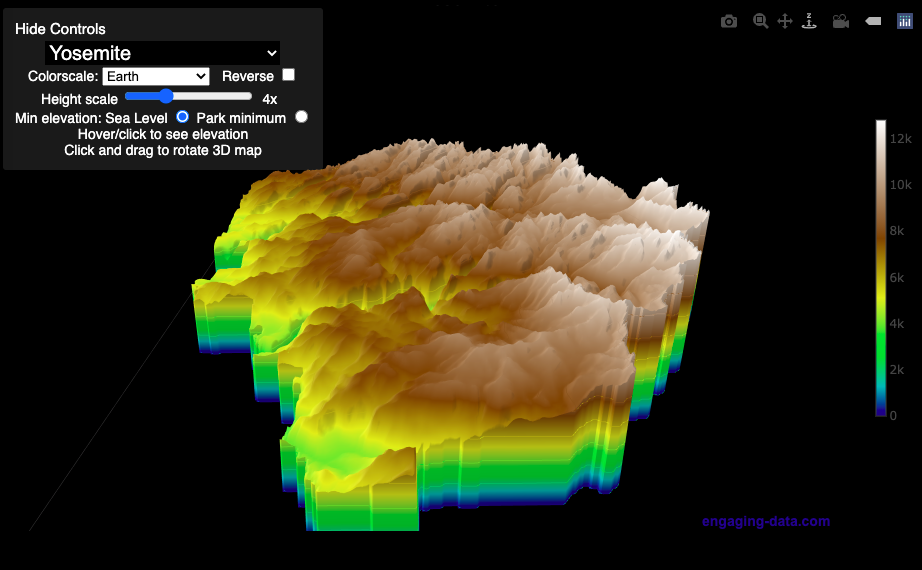
3D Elevation of National Parks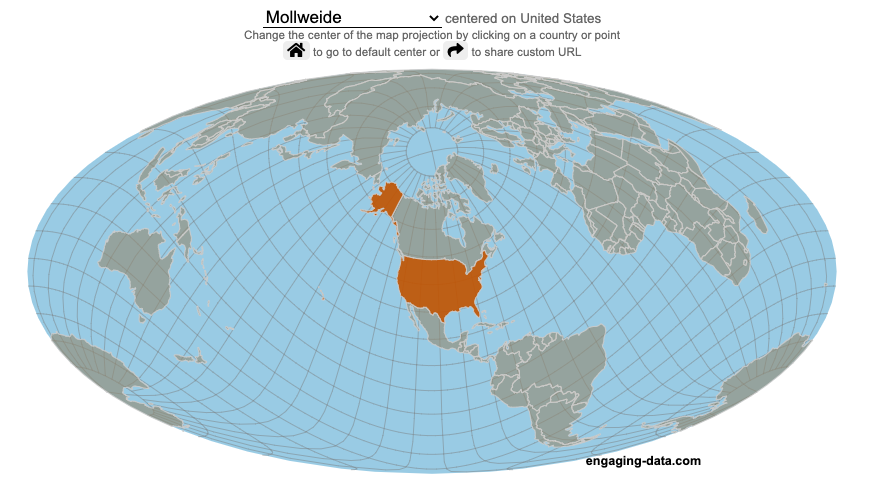
Country-Centered Maps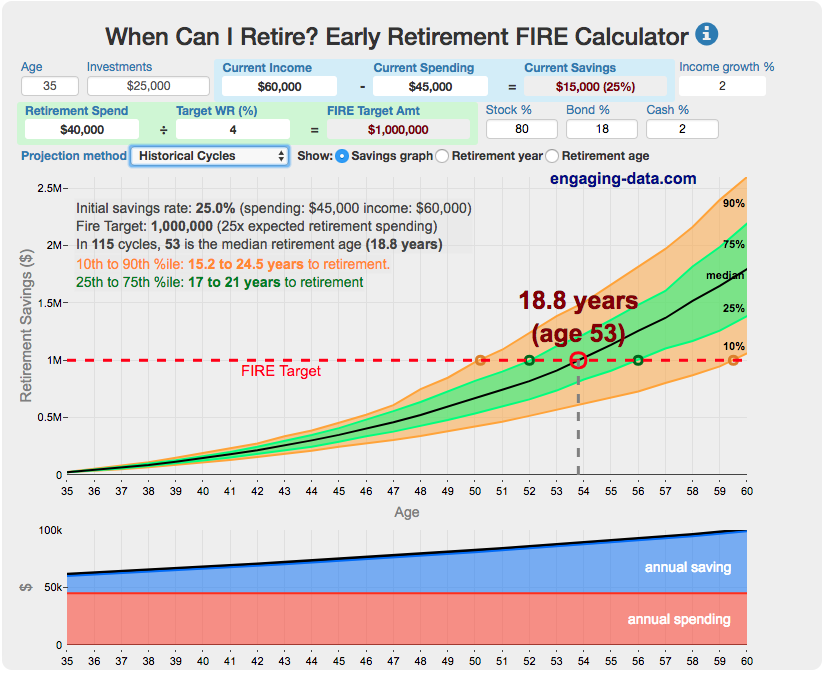
Early Retirement Calculators and Tools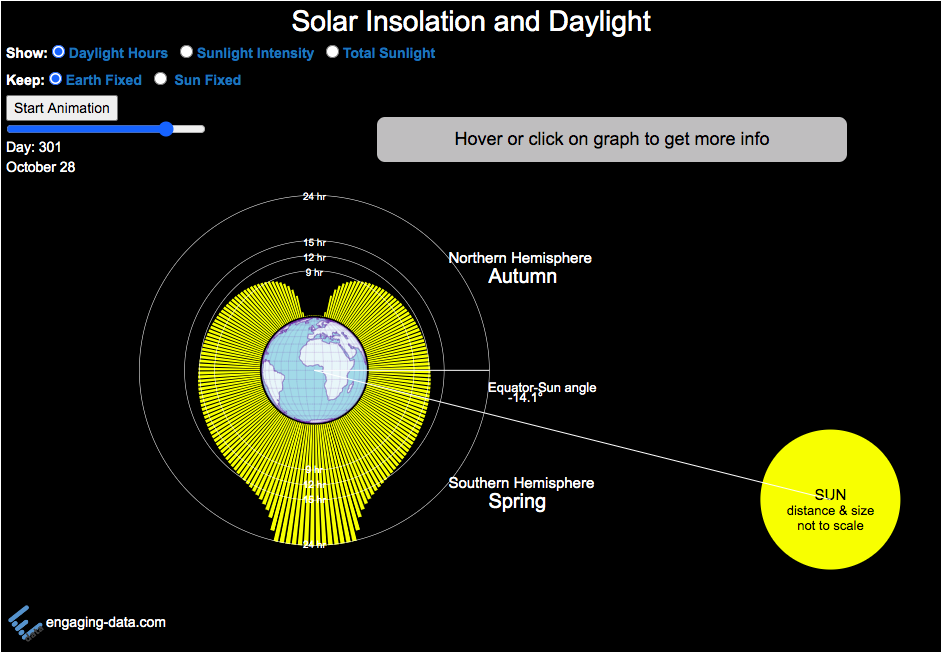
Hours of Daylight by Latitude/Season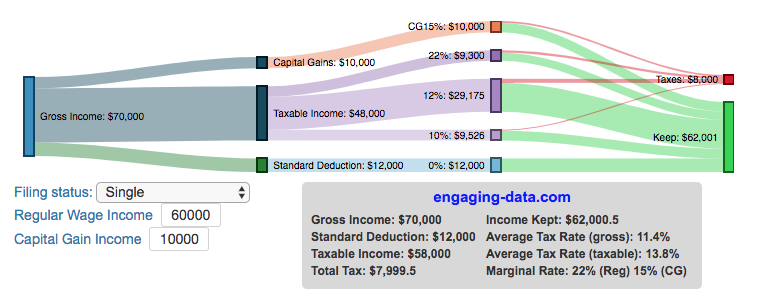
Income Tax Bracket Visualizer- Early retirement calculator – When can I retire?
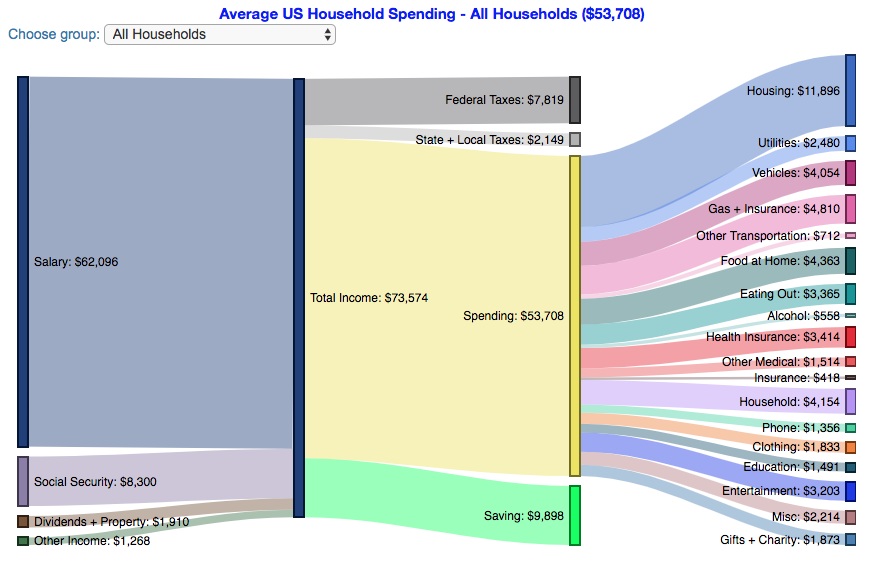
US Household Spending By Income Group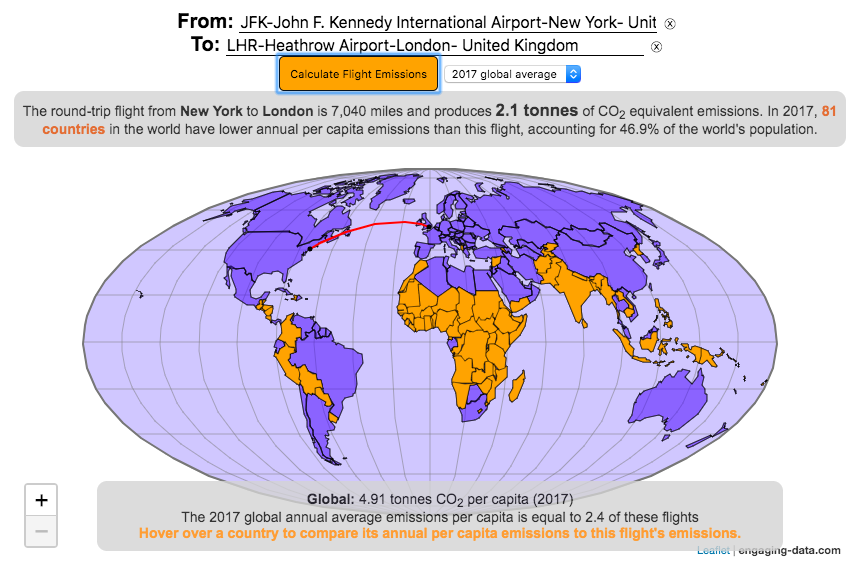
Airplane Flight Emissions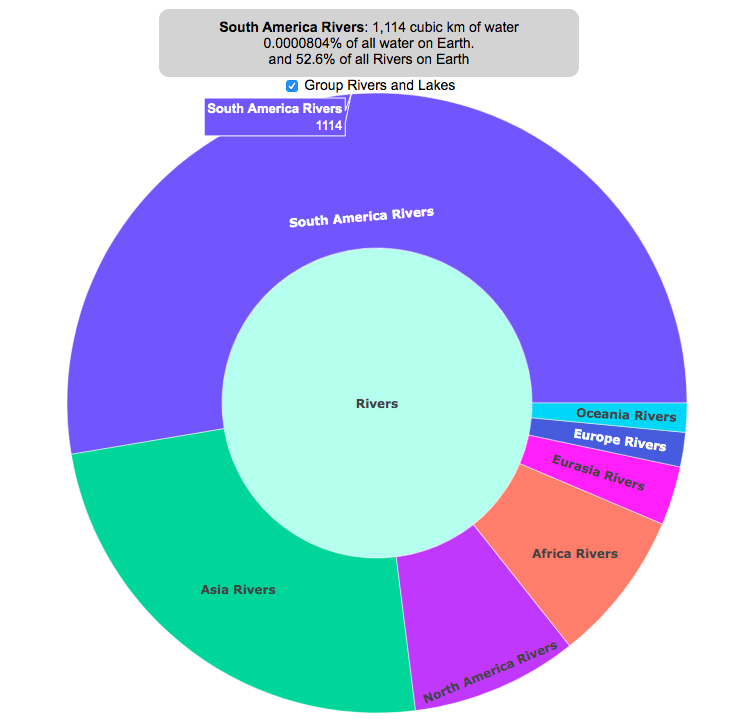
Where is all the water on Earth?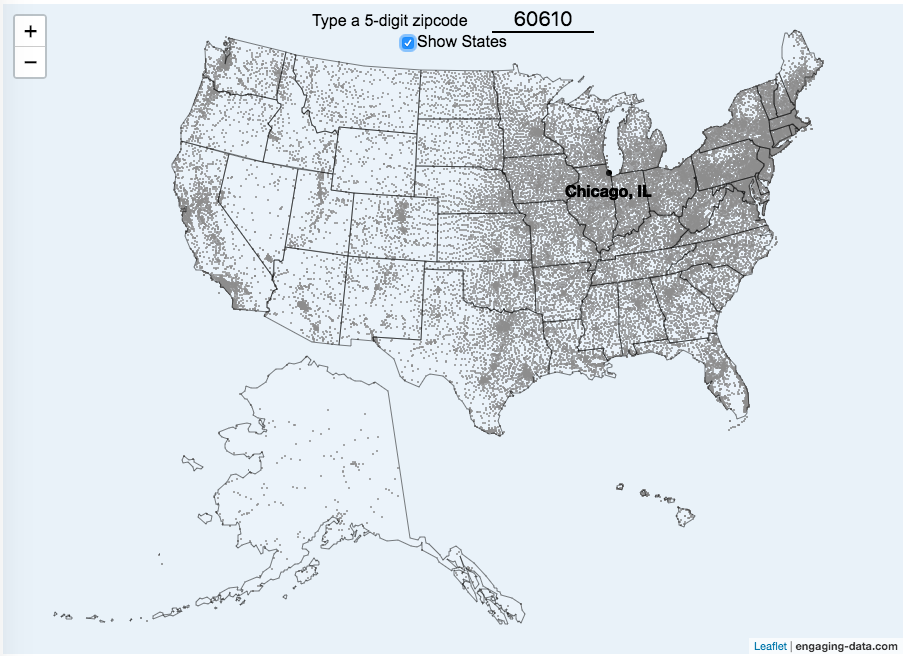
Interactive US Zip Code Map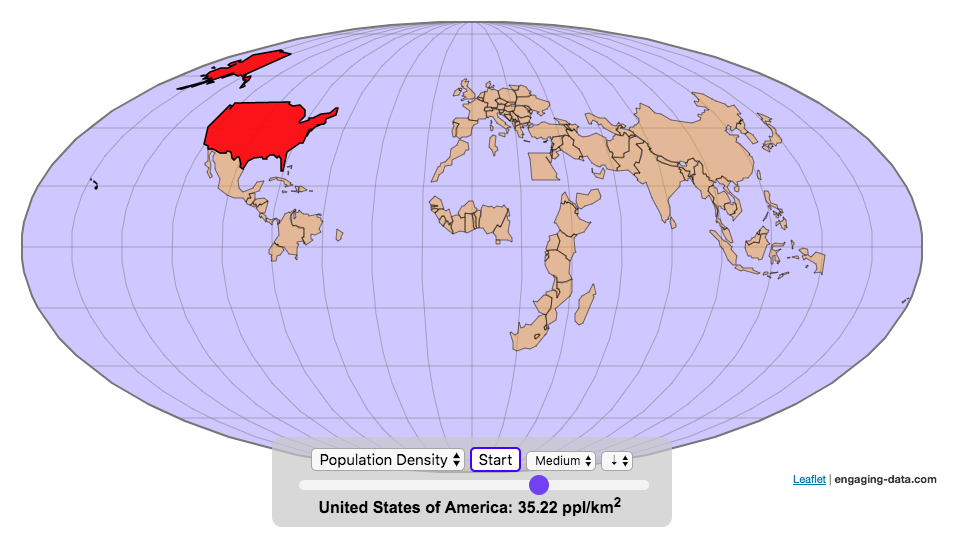
Assembling the World Country-by-Country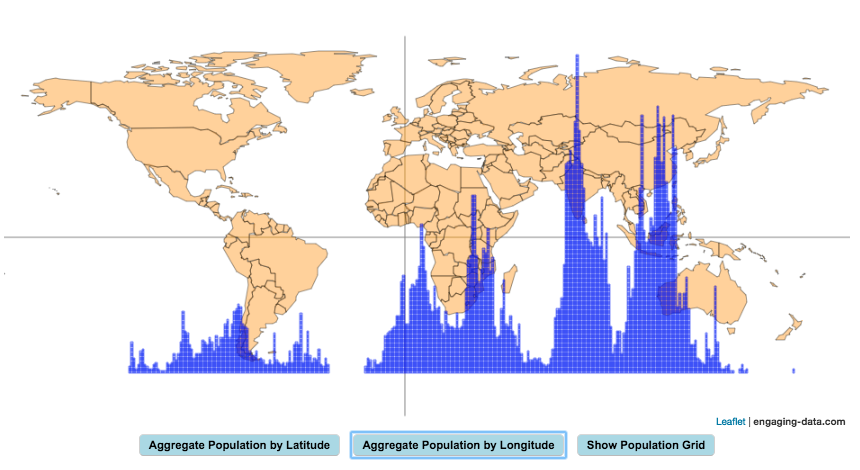
Population by Latitude and Longitude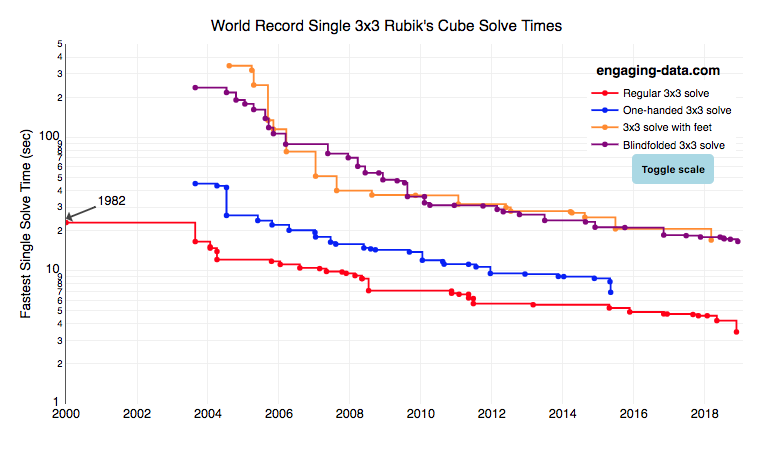 Rubik’s cube world records over time
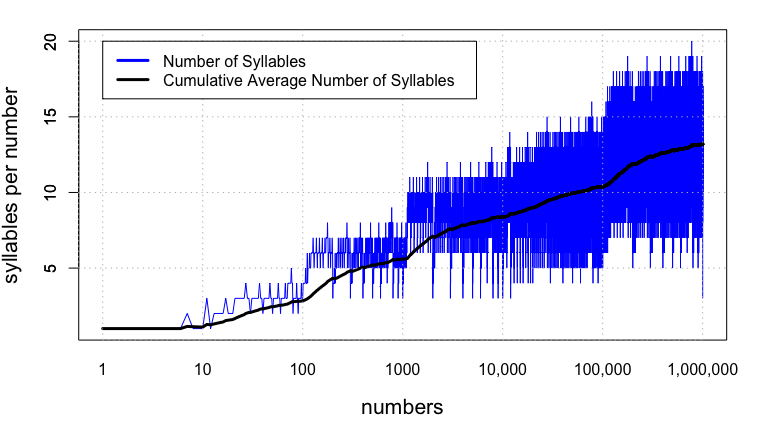 How long does it take to count to one million?
 Antipodes map
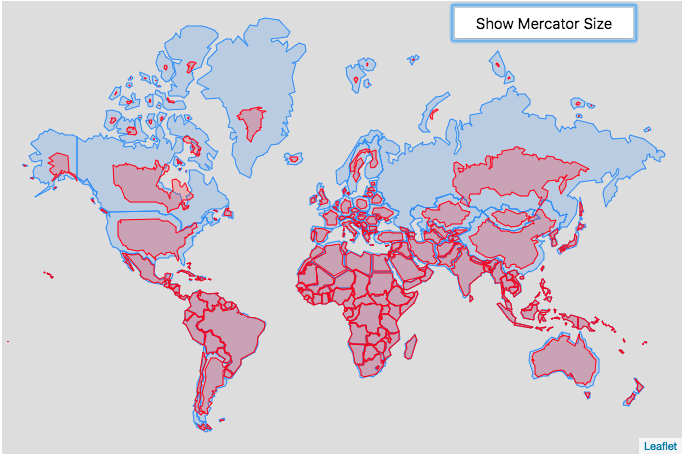 Mercator country size distortion
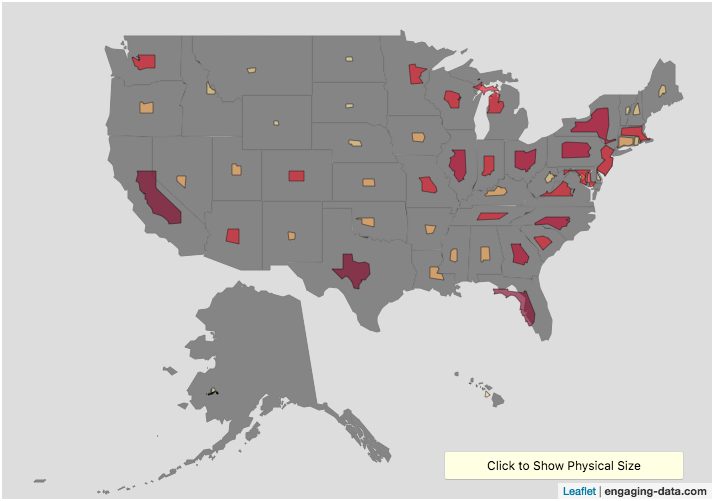 States re-sized to match population
 How much water is in California reservoirs?
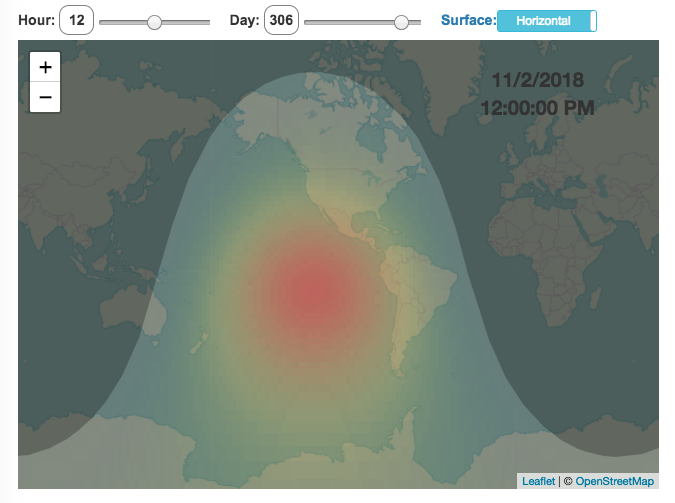
Solar Intensity By Location and Time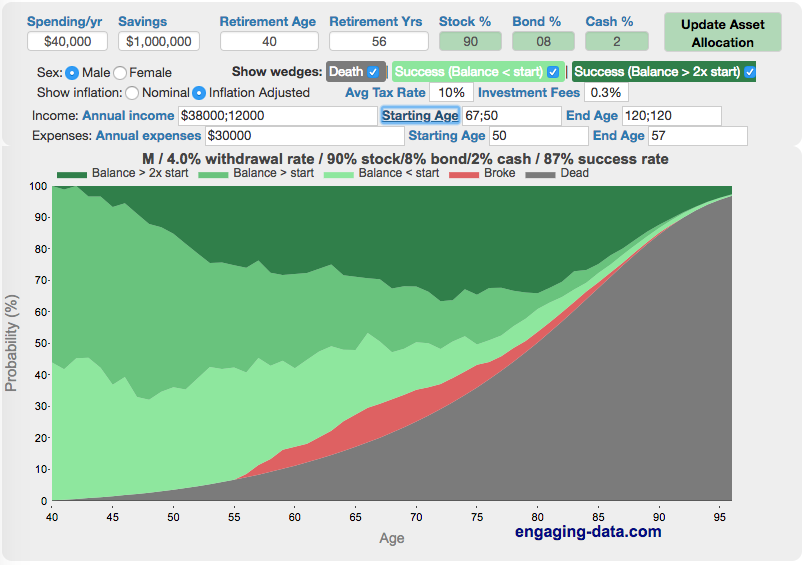
Rich, Broke or Dead – Early retirement and longevity
Visualizations involving maps and geographic data
- Global Birth Map
- Splitting the US by Population
3D Elevation of National Parks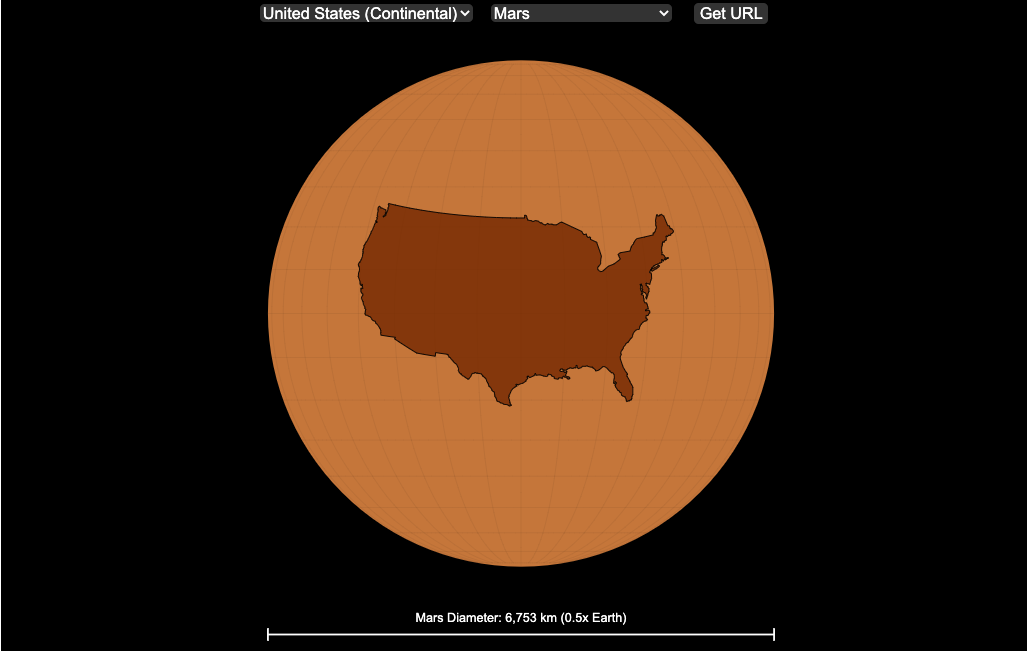
Mapping Countries onto Planets
Country-Centered Maps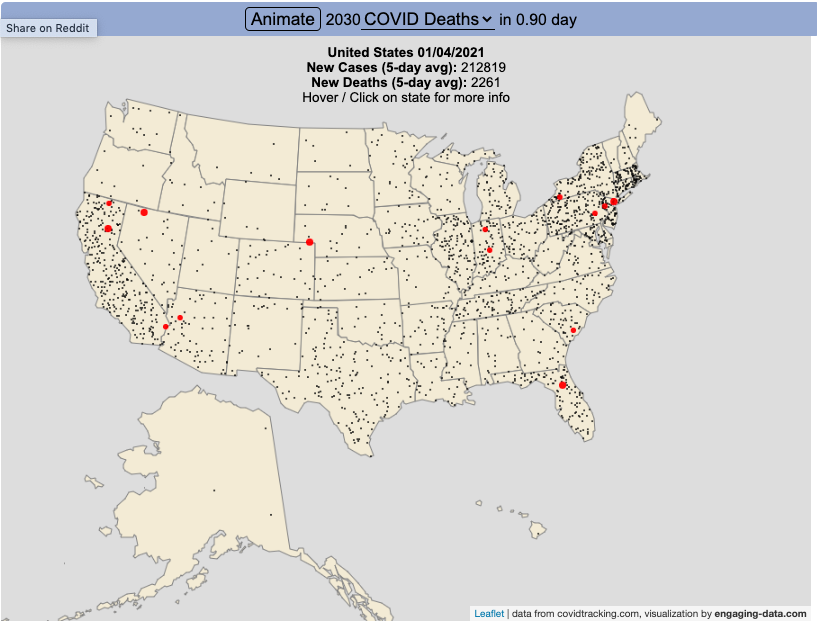
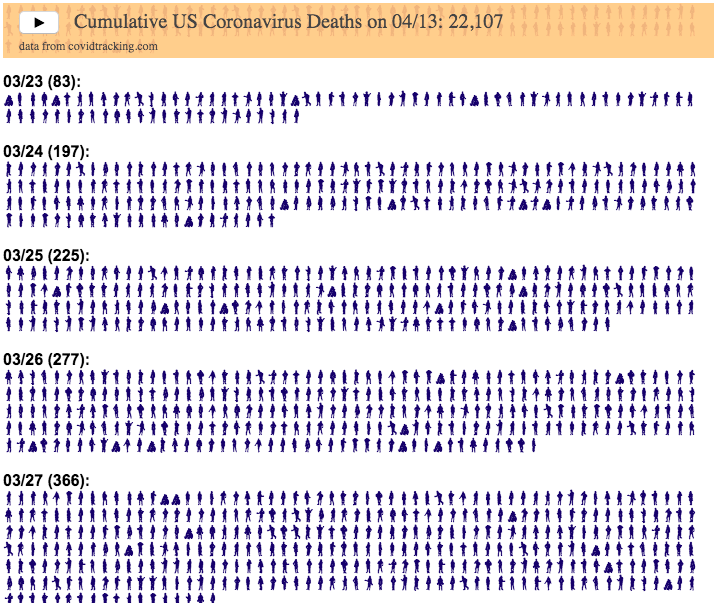
Animating US COVID cases/deaths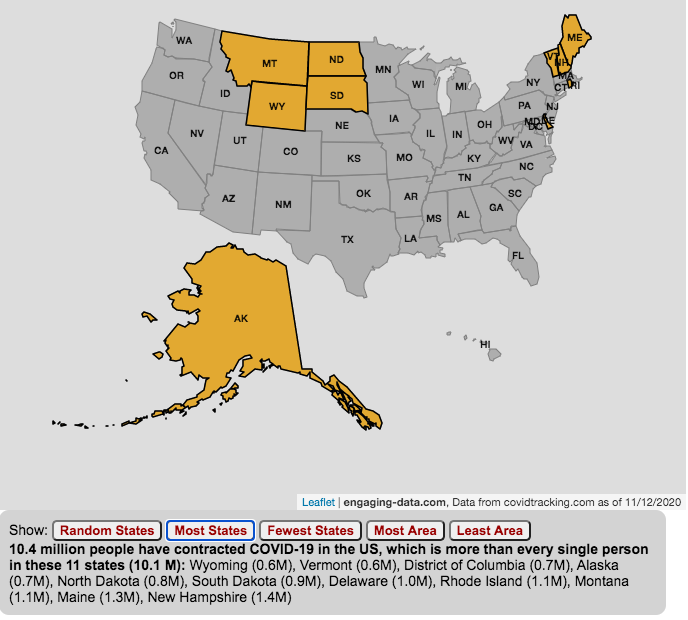
Number of US COVID cases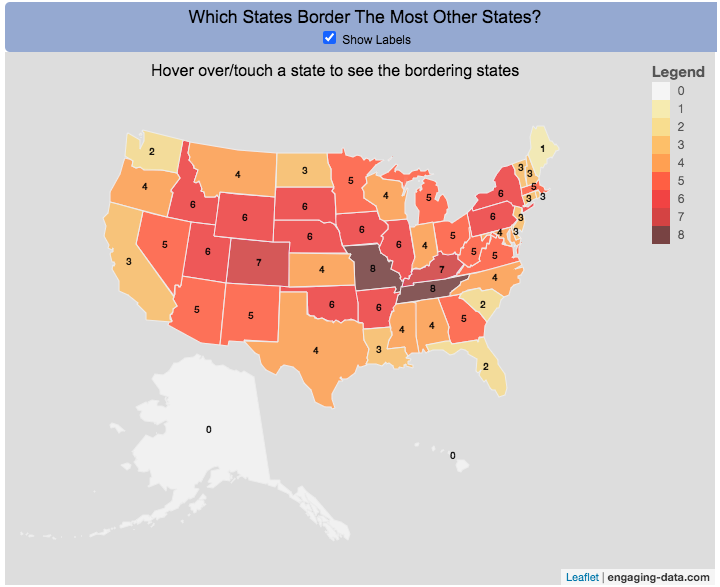
Which State Borders The Most Other States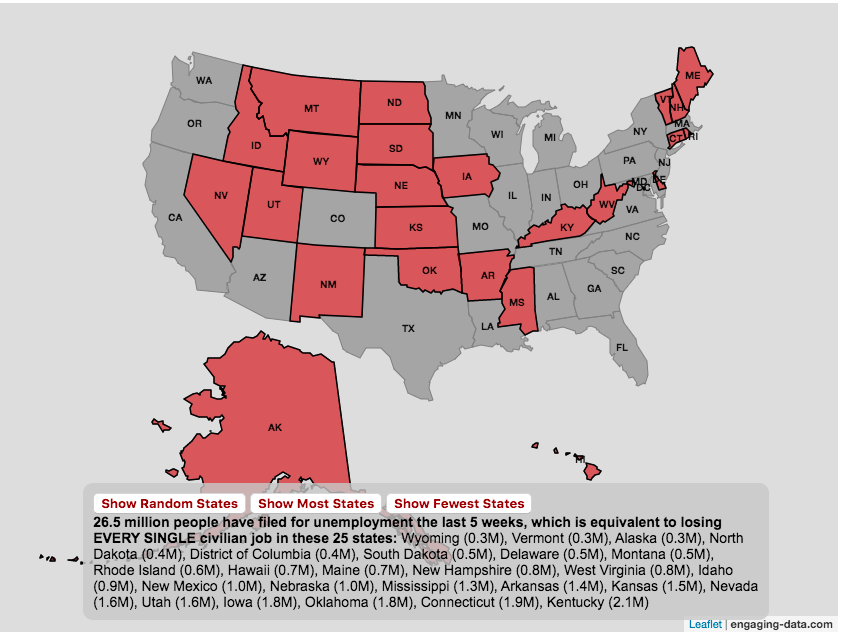
US Unemployment Equal to These States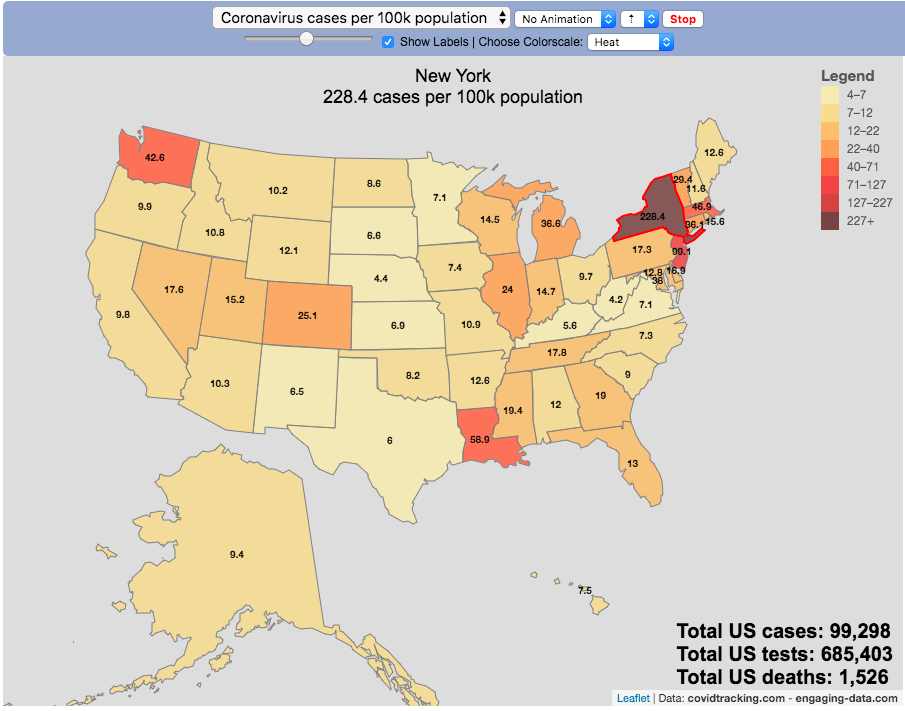
US Coronavirus statistics by state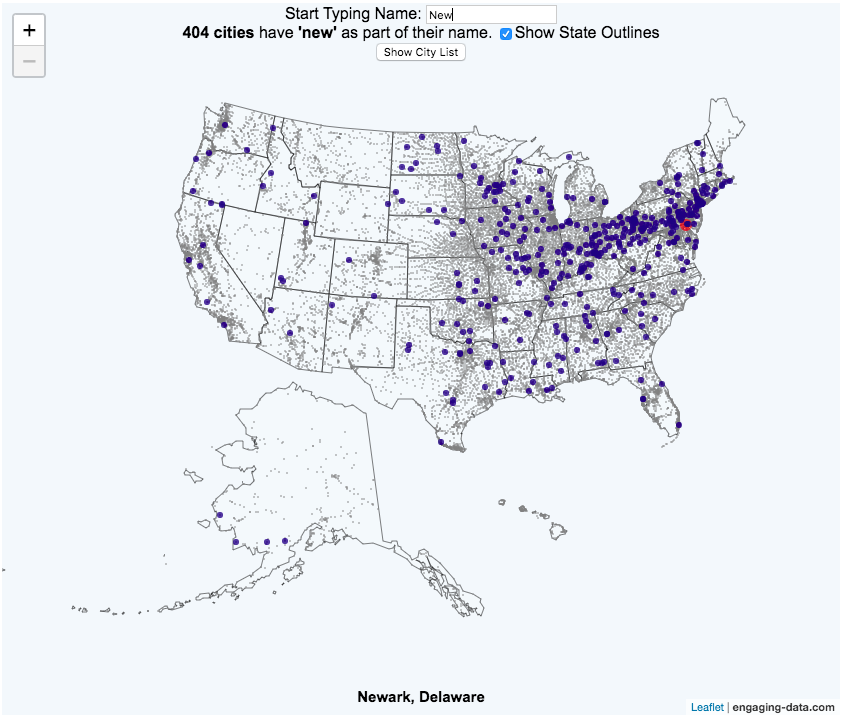
US City Name Map
County Electoral Map – Land Area vs Population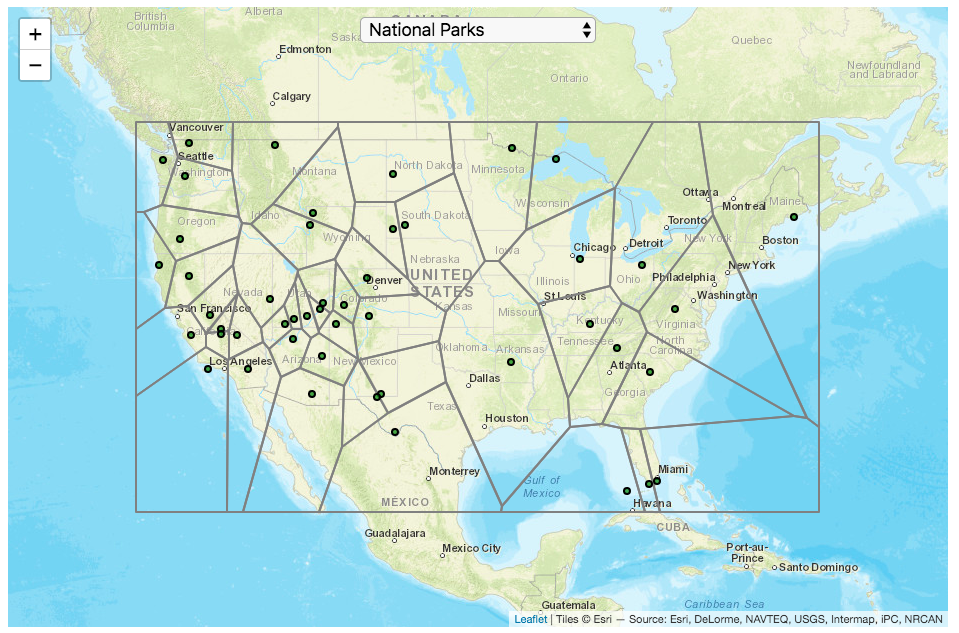
Which National Park Is Closest To You?
Interactive US Zip Code Map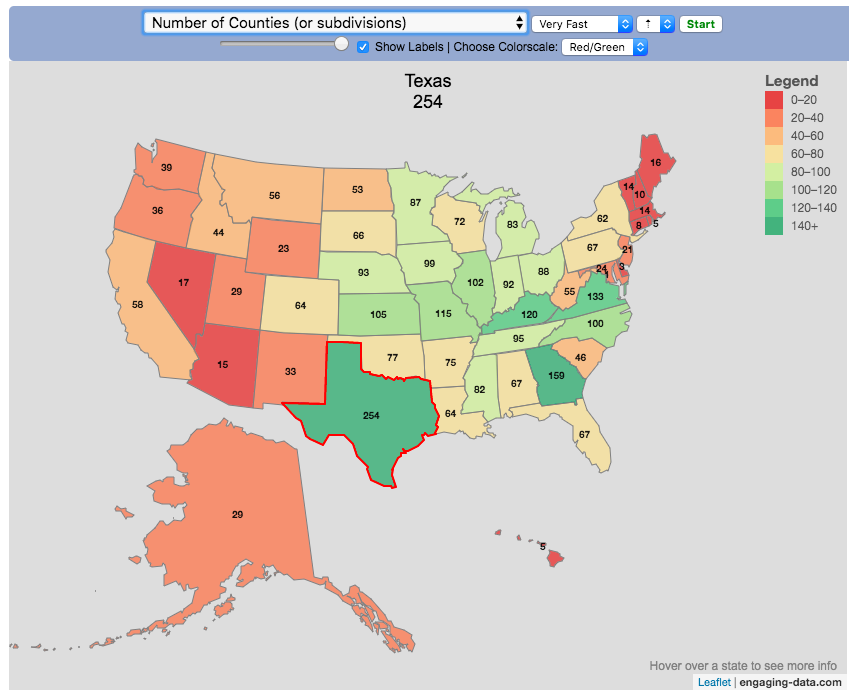
Assembling the USA state-by-state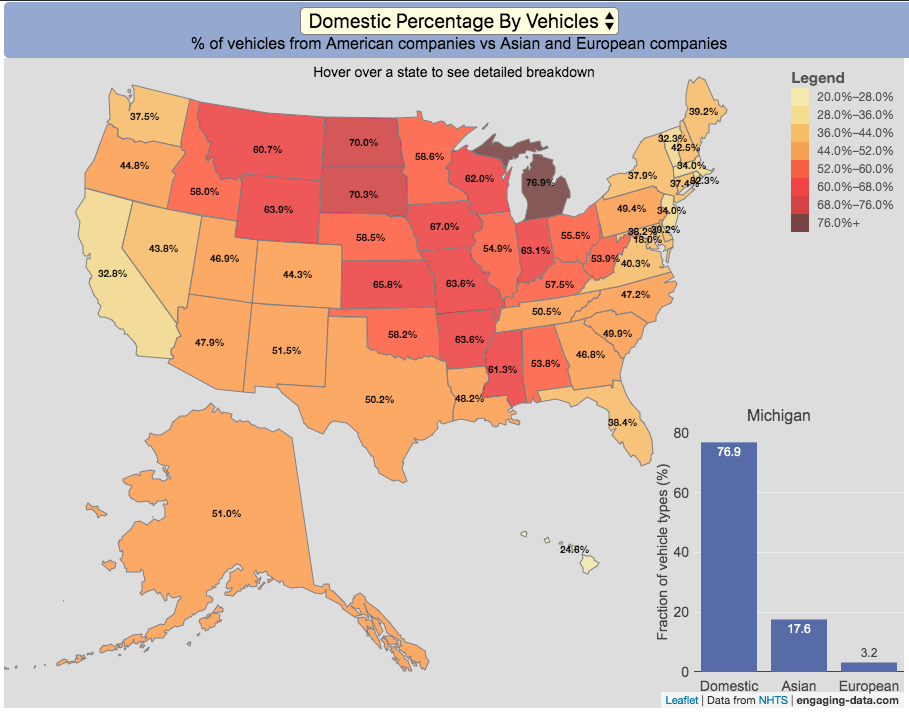
Kinds of cars and trucks by state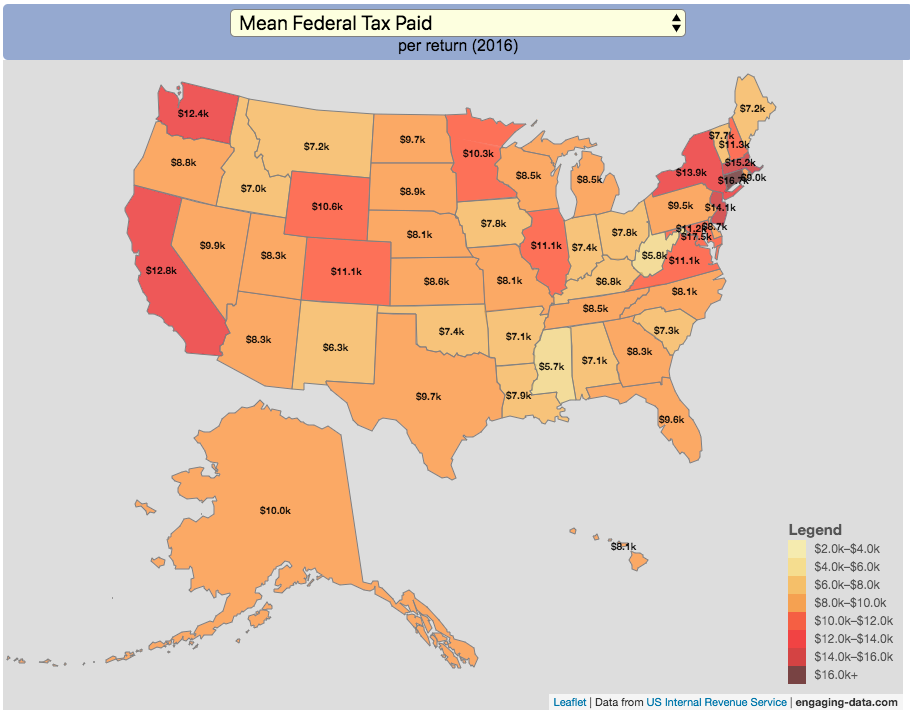
How much does each state pay in taxes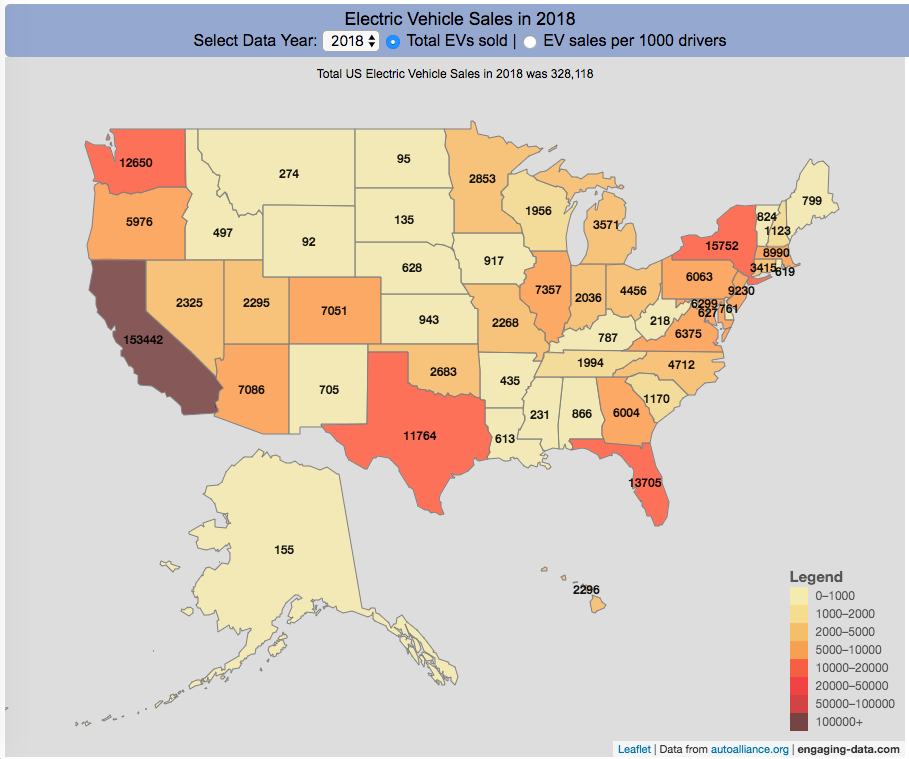
Electric vehicle sales by state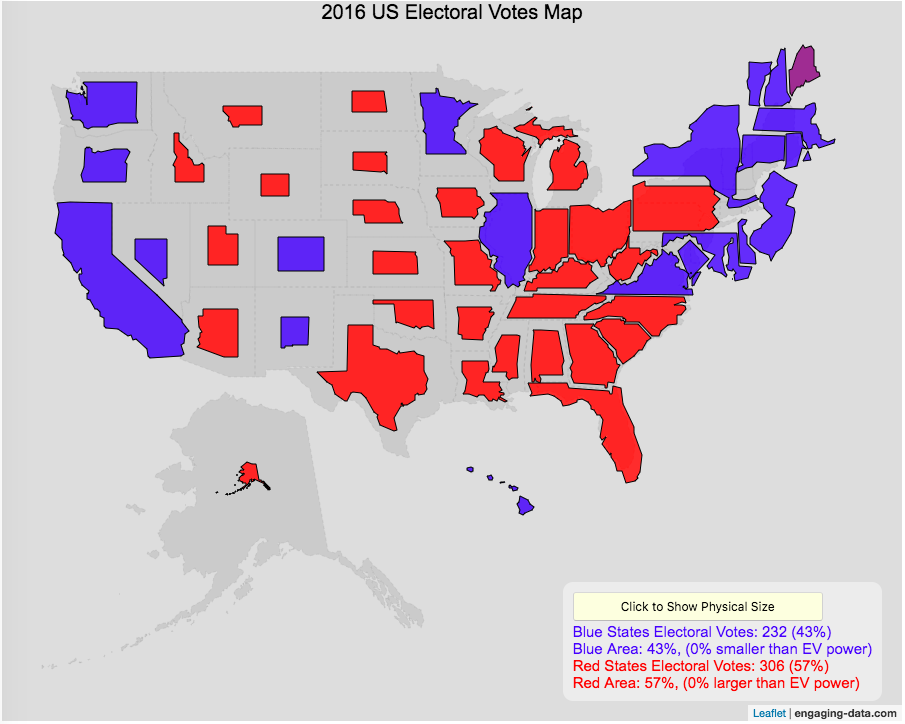 States re-sized to electoral votes
Assembling the World Country-by-Country
Population by Latitude and Longitude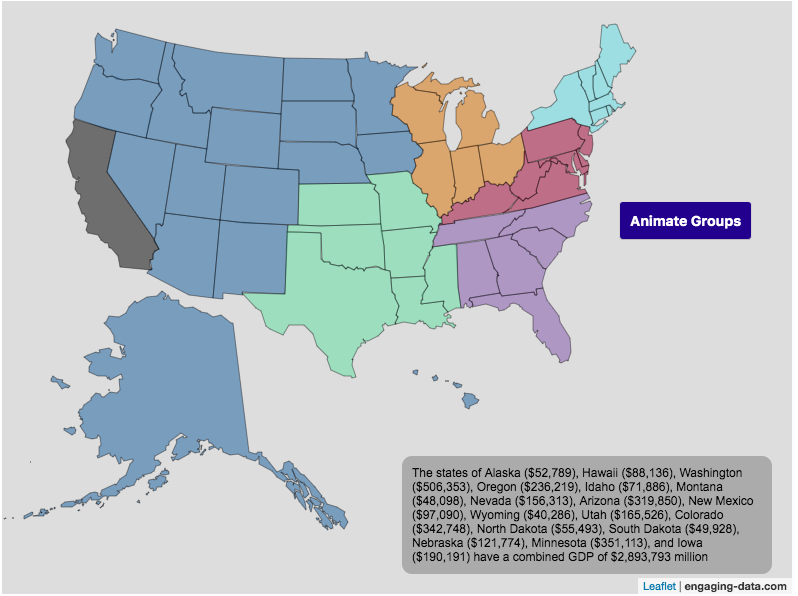
Size of California Economy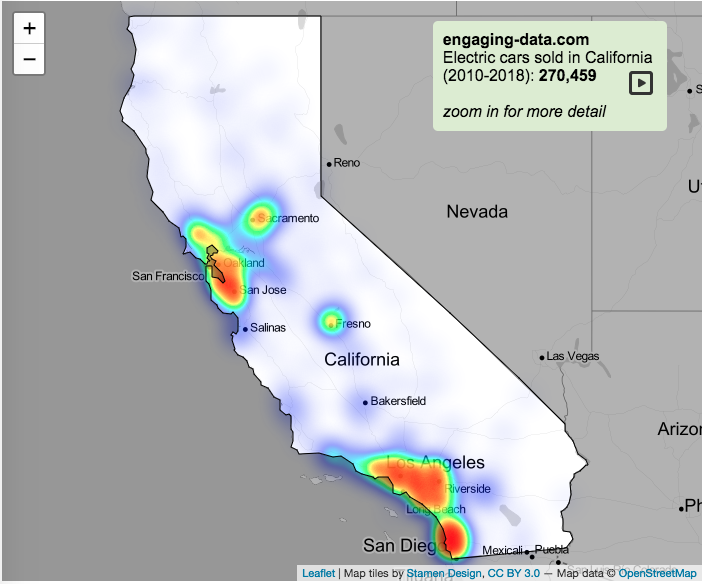
Heatmap of California Electric Vehicle Sales
Solar Intensity By Location and Time- Antipodes map
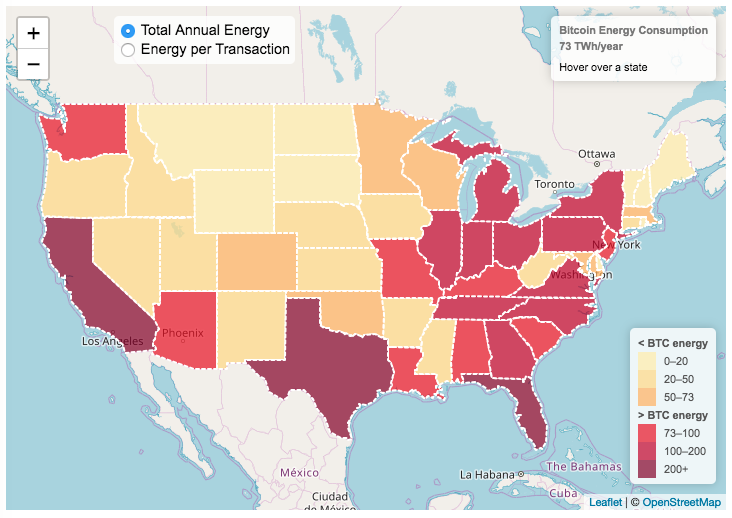
Bitcoin Energy Consumption vs Your State- Mercator country size distortion
- States re-sized to match population
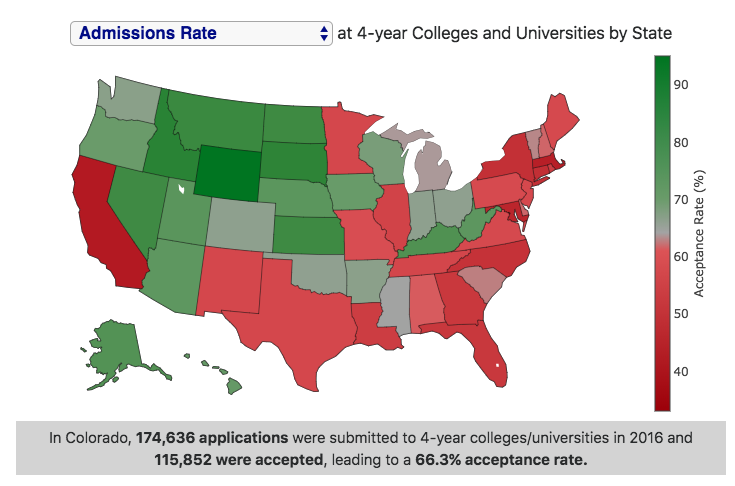 College admissions by state
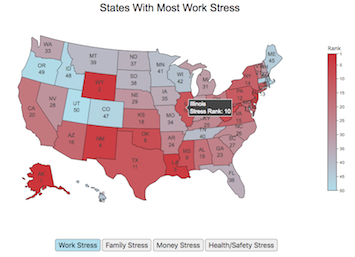
Which states are the most stressed?
These visualizations are about Earth’s environment
- California Electricity Generation
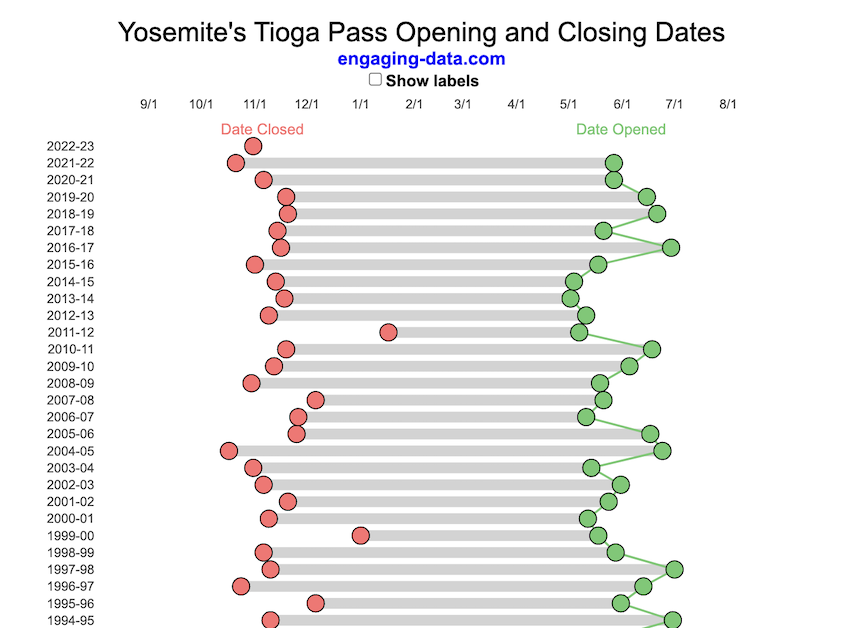
Tioga Pass Opening Dates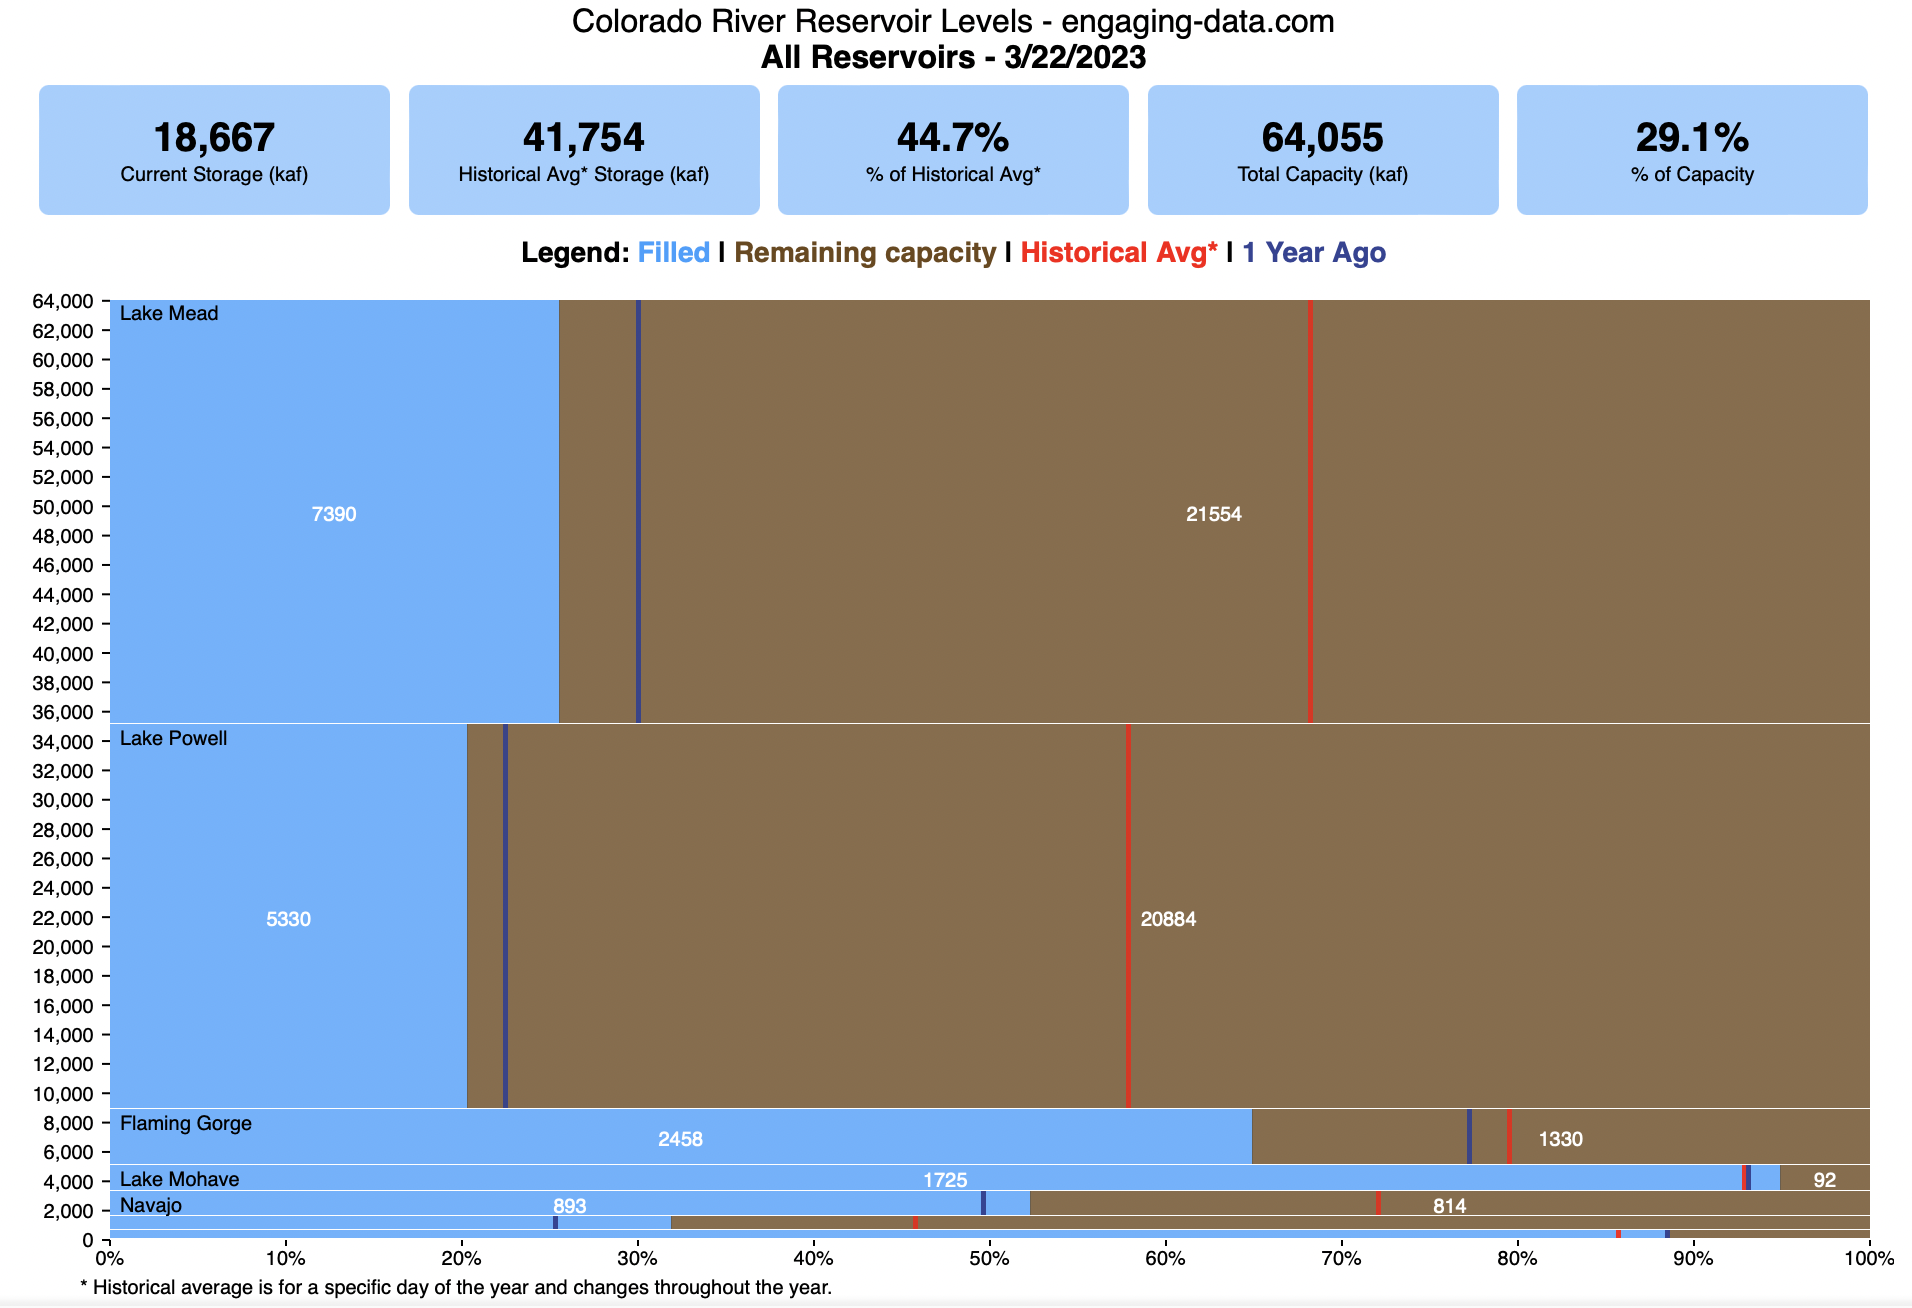
Colorado River Reservoir Levels
California Reservoirs and Snowpack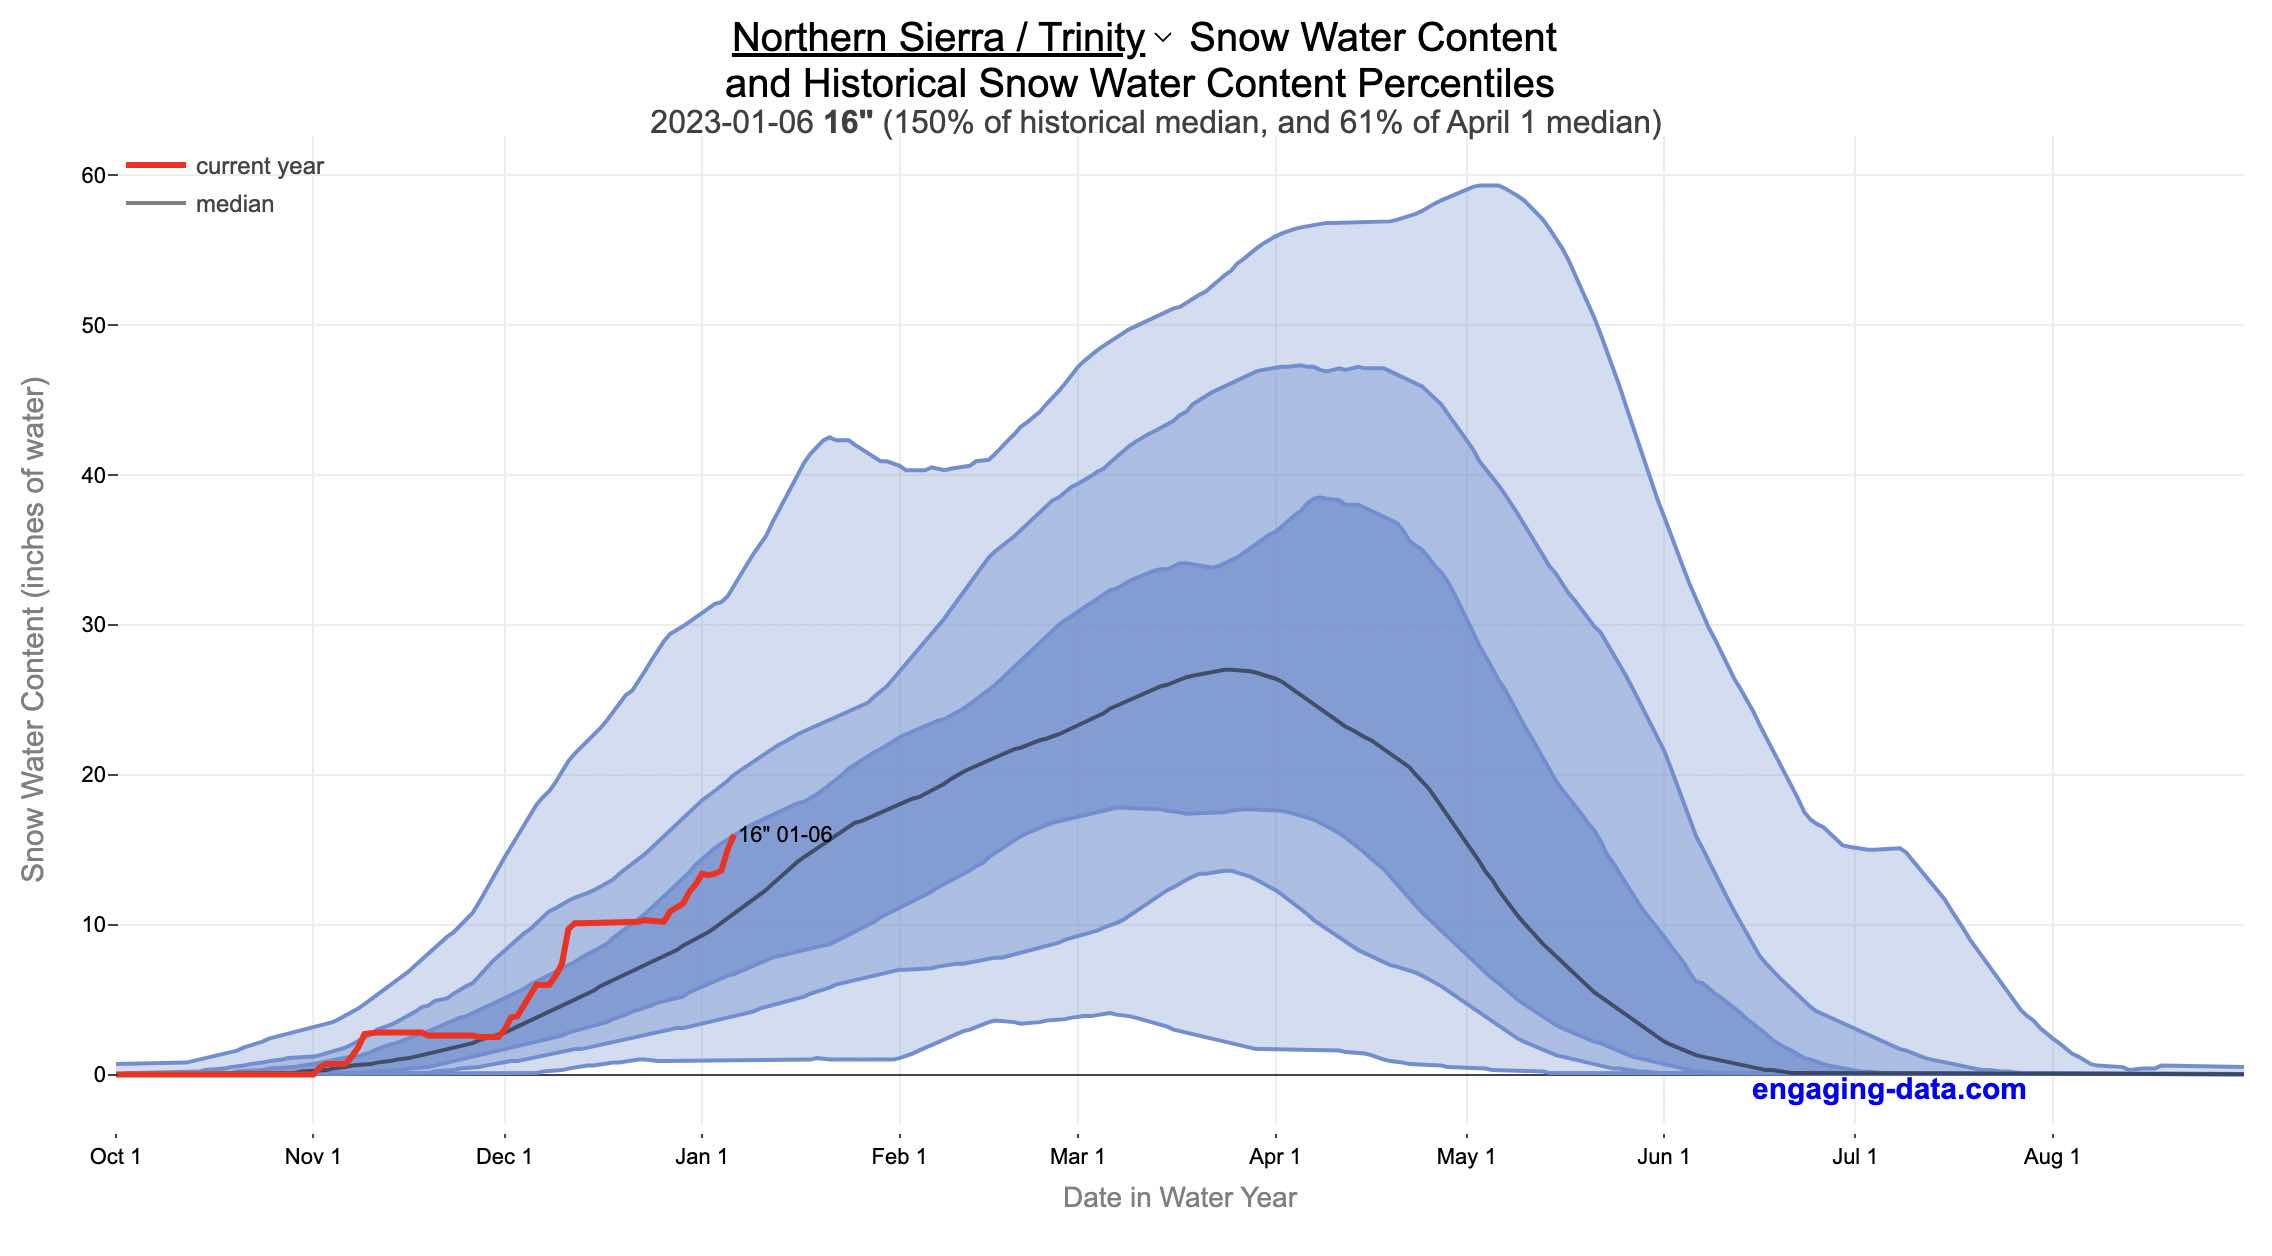
California Snowpack Levels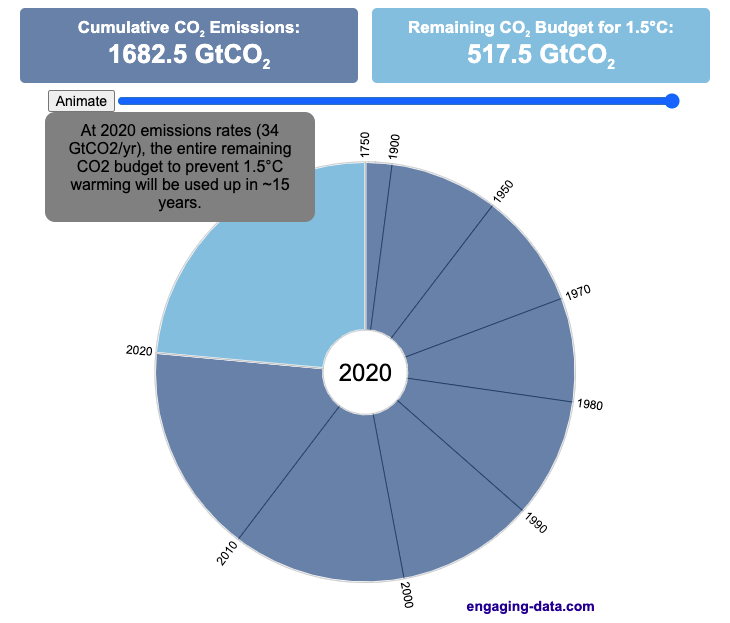
Using up our Carbon Budget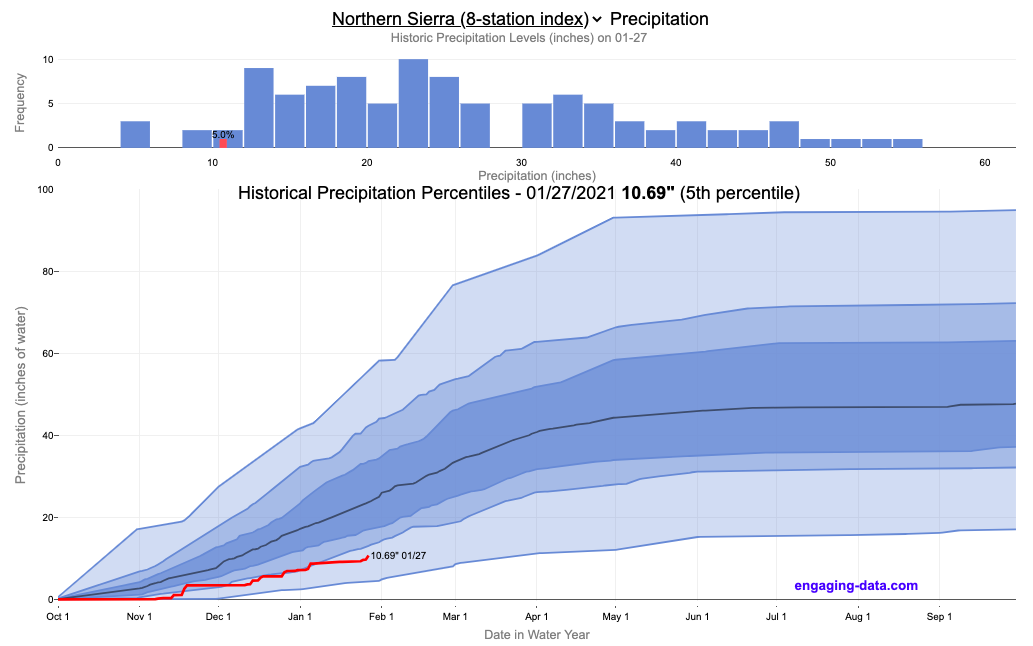
California Rainfall Totals
Where is all the water on Earth?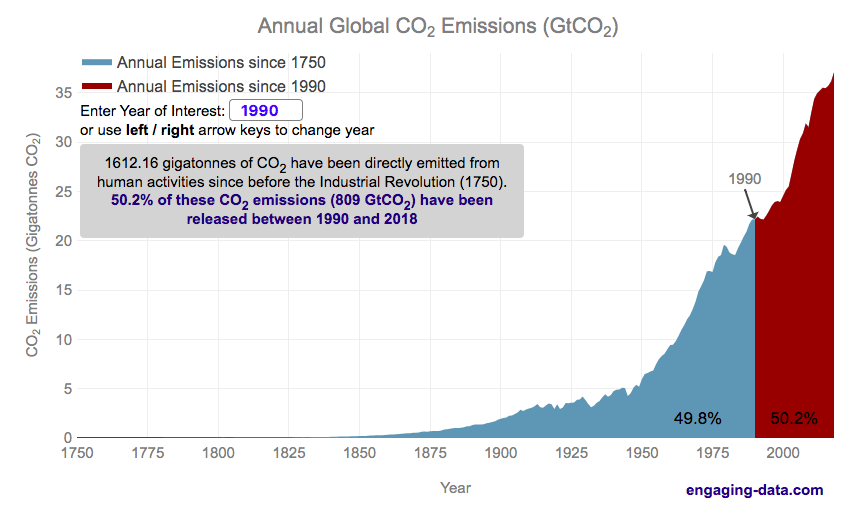
CO2 Emissions Since You Were Born
Airplane Flight Emissions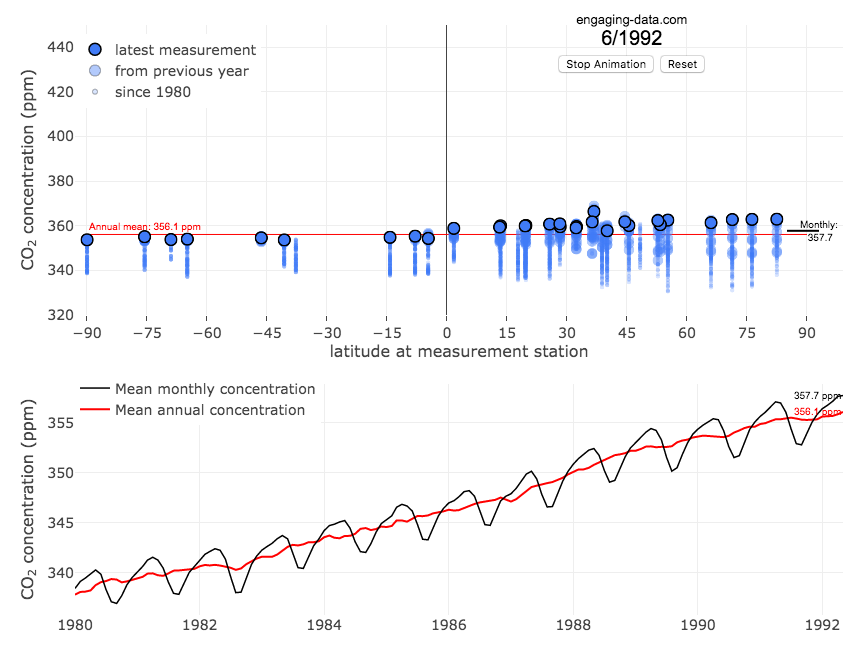
CO2 Concentration Animation
California Reservoir Dashboard- How much water is in California reservoirs?
These visualizations focus on energy production and usage
These visualizations and tools focus on financial topics including financial independence, stock market investing, US taxes, and budgeting and spending.
Income Tax Bracket Visualizer (NEW!)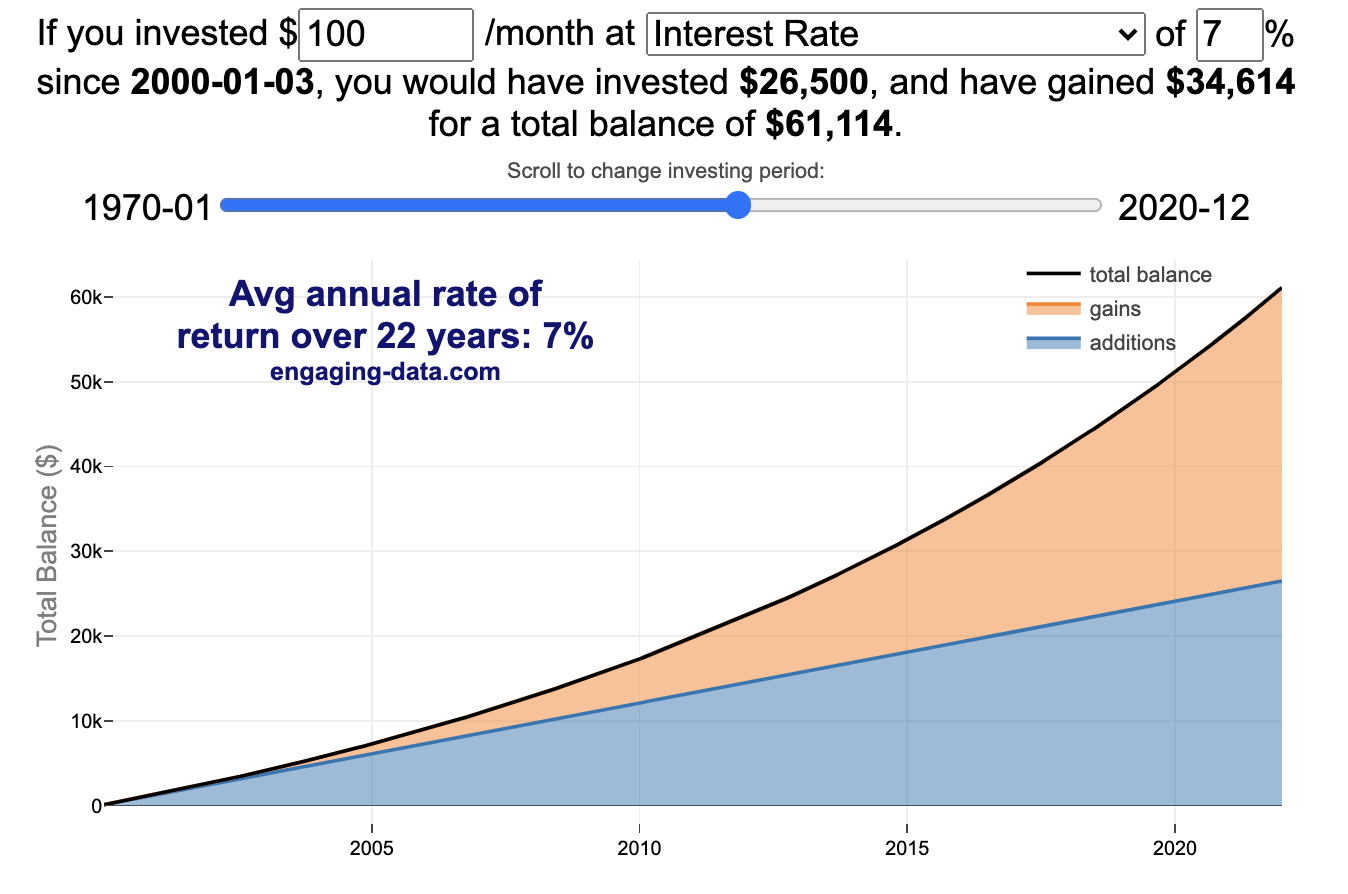
Compound Interest and Stock Returns Calculator
Early Retirement Calculators and Tools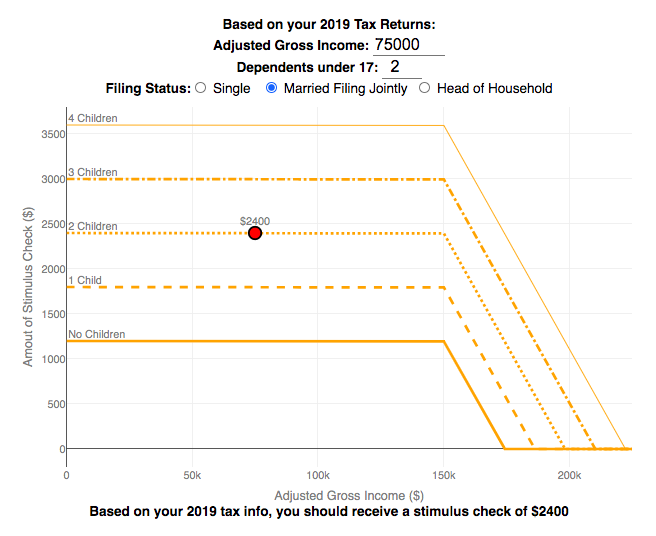
2020 2nd Stimulus Check Calculator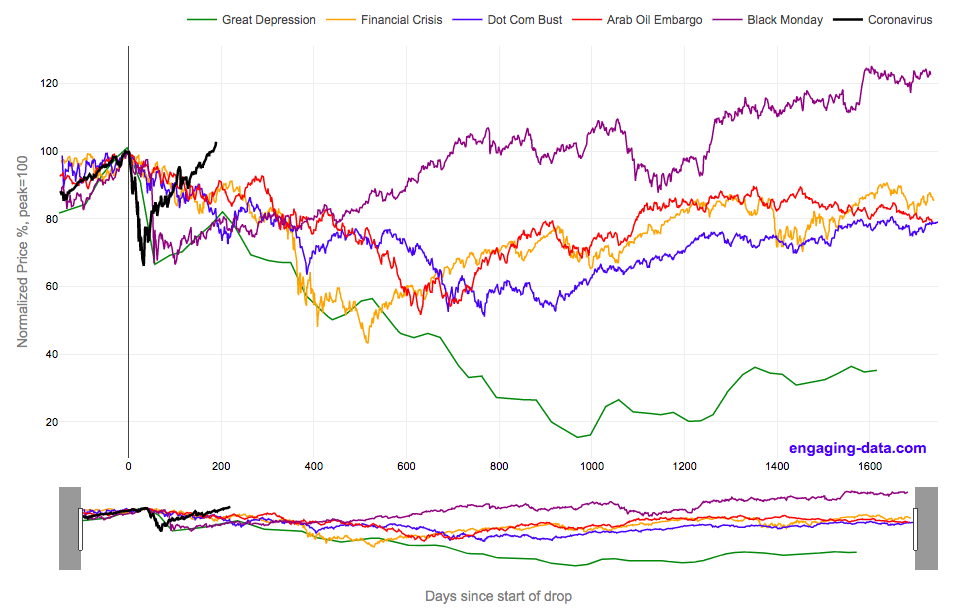
2020 Stock Market Drop vs Other Bear Markets
US Unemployment Equal to These States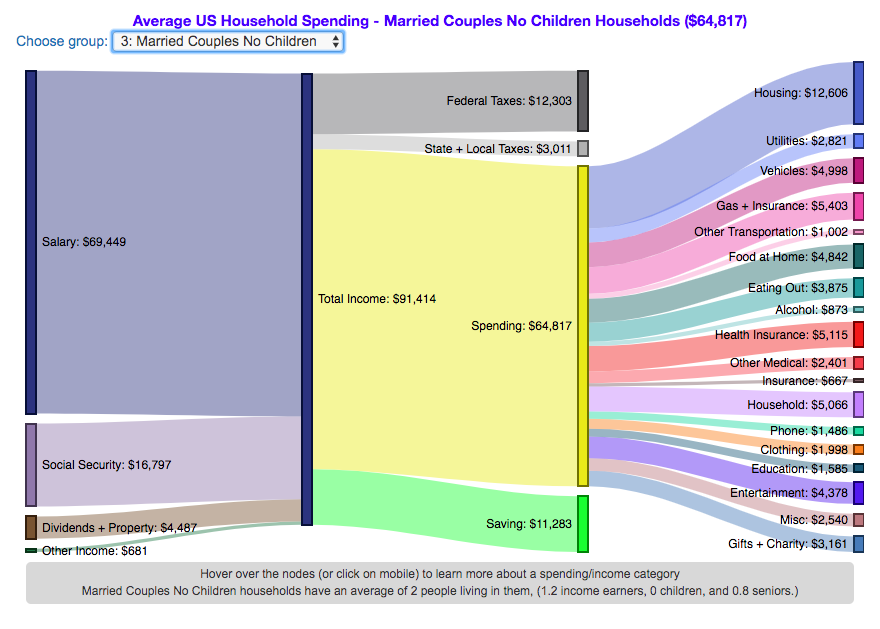
Household Spending By Household Composition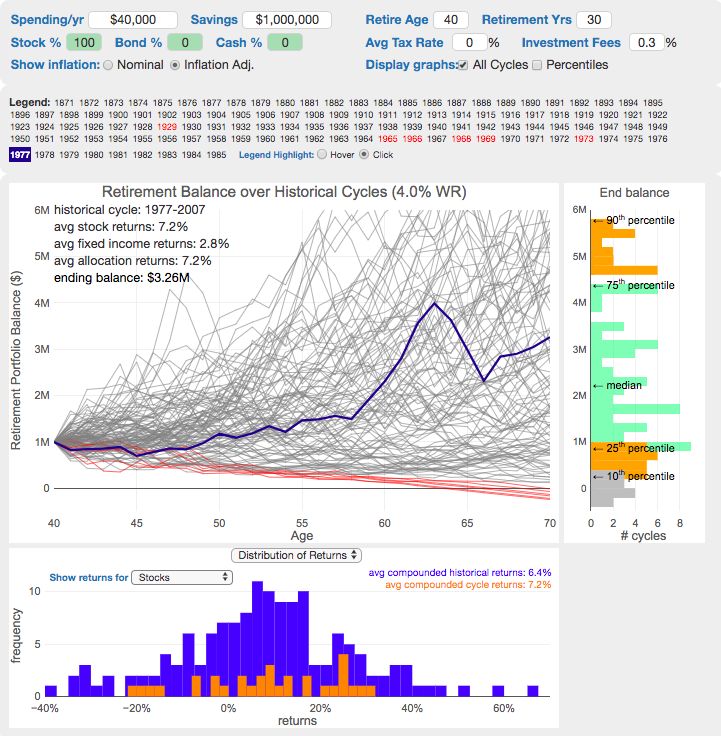
Visualizing the 4% Rule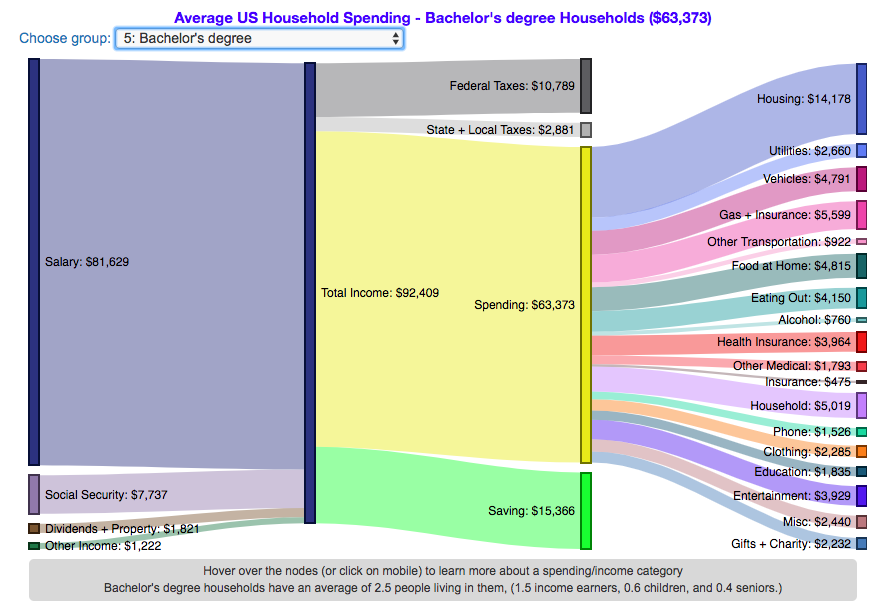
US Household Spending By Education Level
How much does each state pay in taxes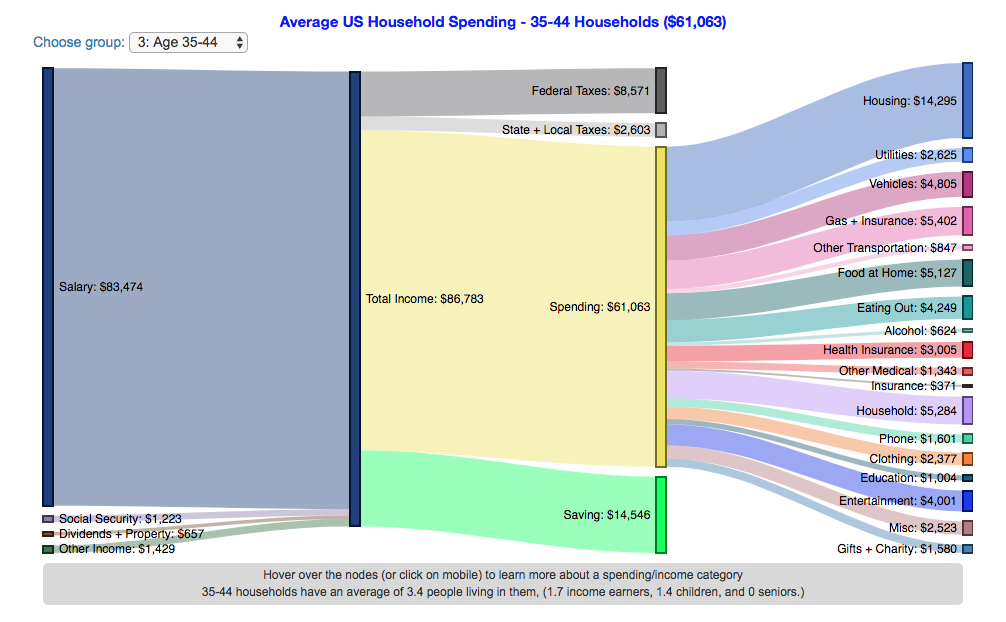
US Household Spending By Age
US Household Spending By Income Group
Income Tax Bracket Visualizer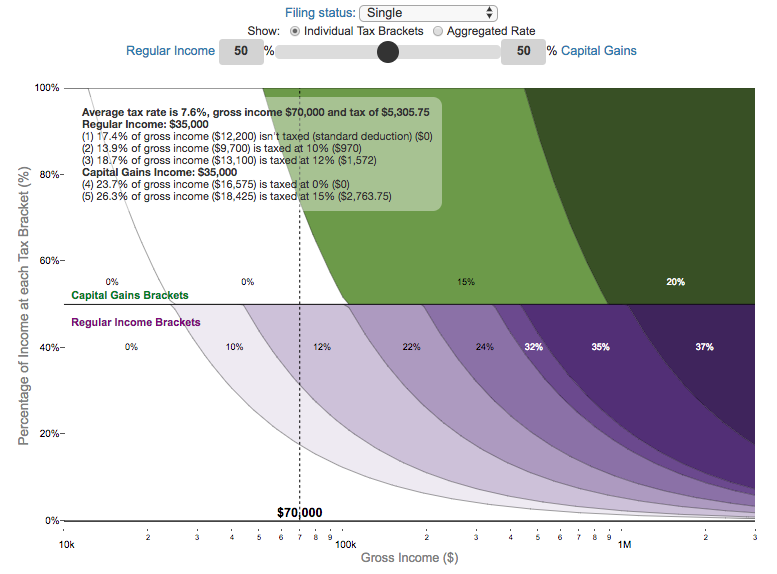
Understanding Marginal Tax Rates
Early retirement calculator – When can I retire?
Rich, Broke or Dead – Early retirement and longevity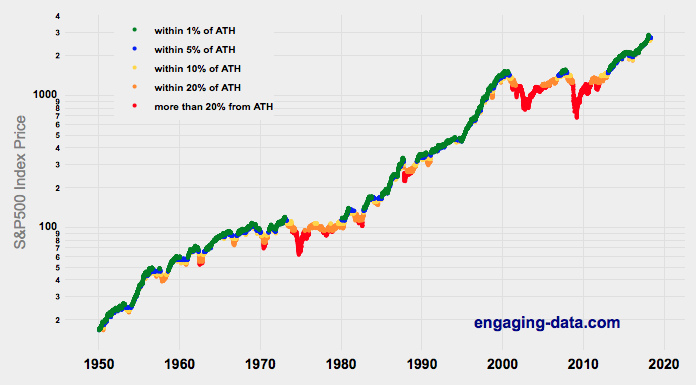
Invest when market is at an all-time-high?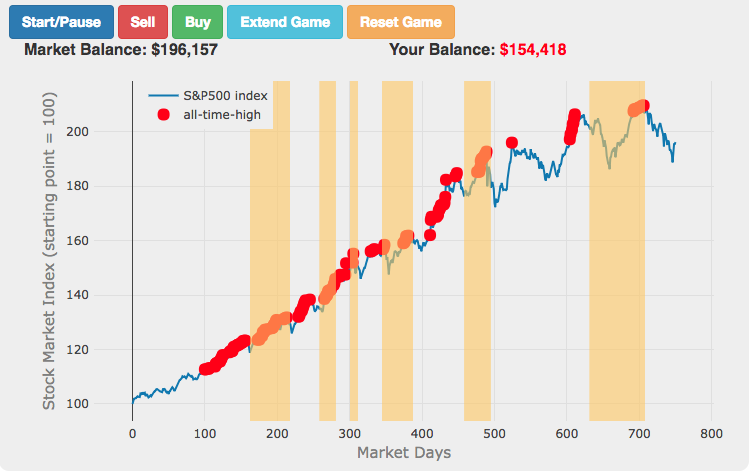
Stock market timing game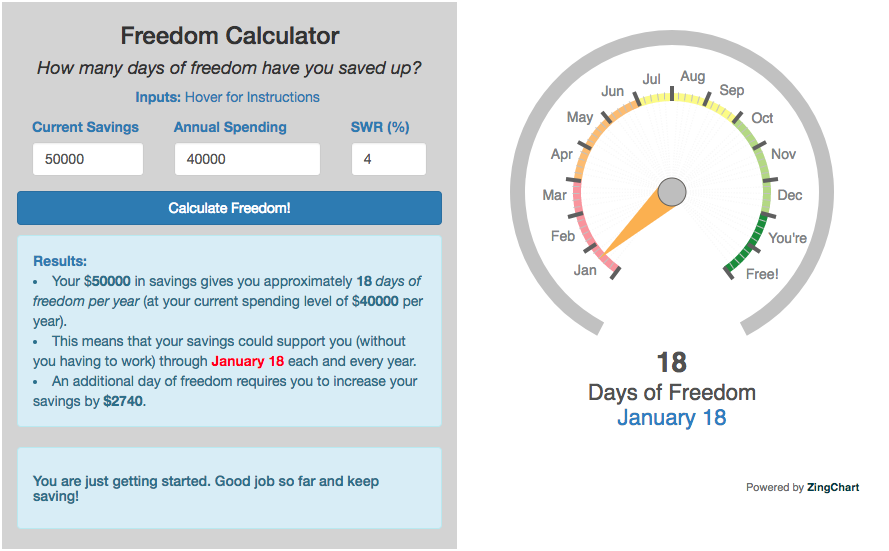
Financial freedom calendar
These visualizations focus on US politics and societal issues.
California is fourth largest economy- Baby name popularity visualizer
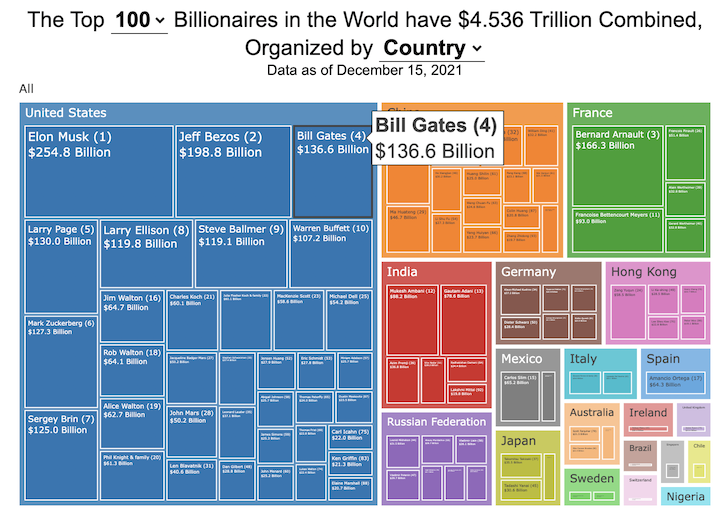 How rich are the top billionaires?
- How Rich is Elon Musk? shown in pixels
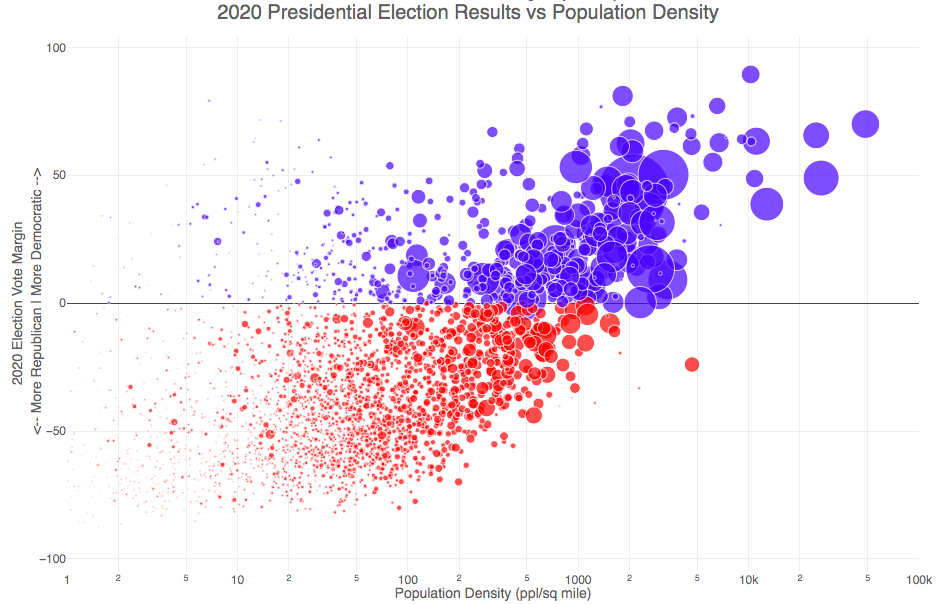
Election by Population Density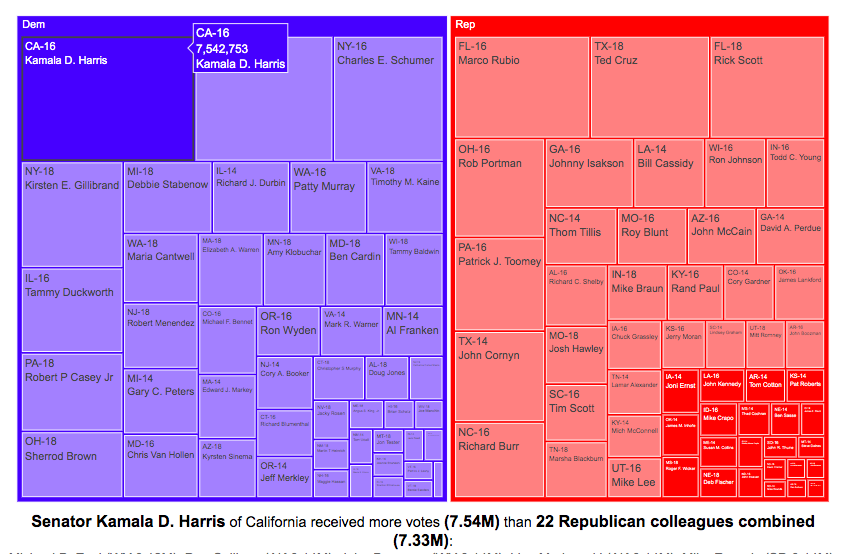
Vote Totals by Senator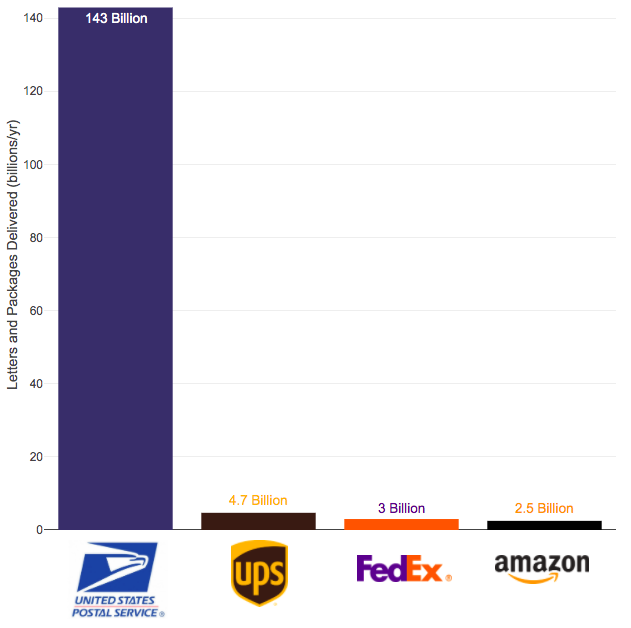
USPS vs private delivery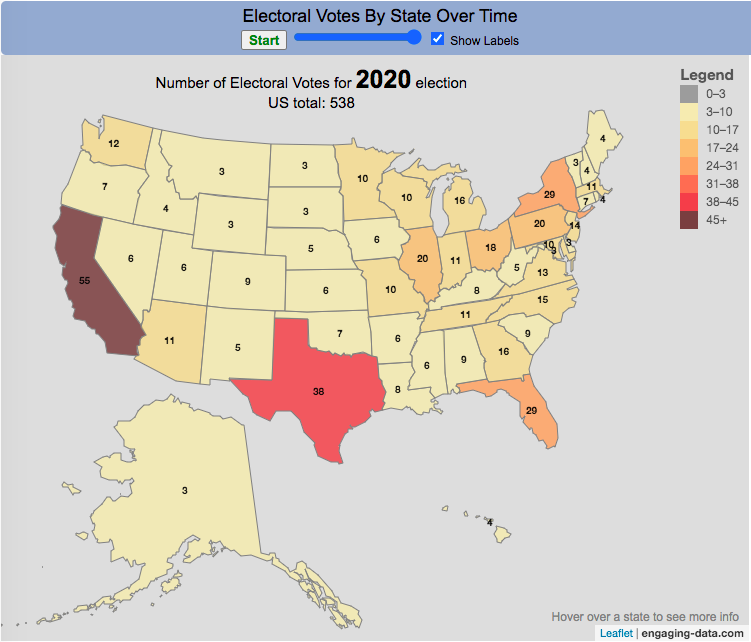
Number of Electoral Votes over Time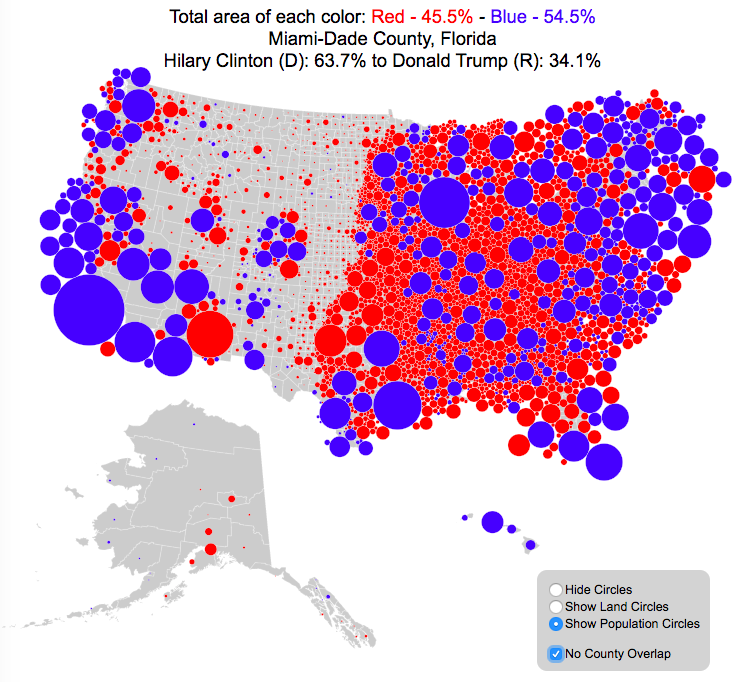
County Electoral Map – Land Area vs Population- States re-sized to electoral votes
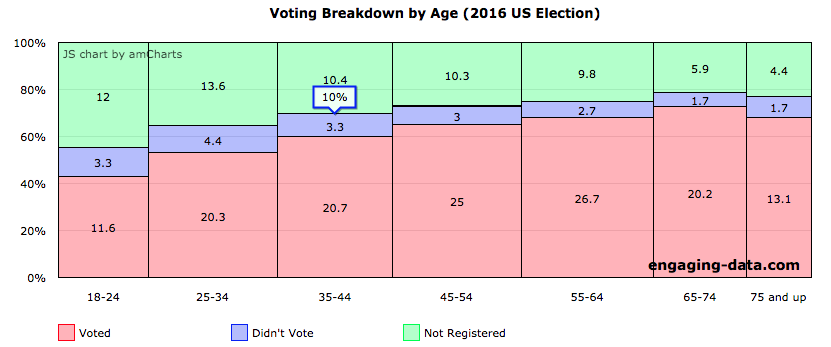 Demographic characteristics of US voters in 2016
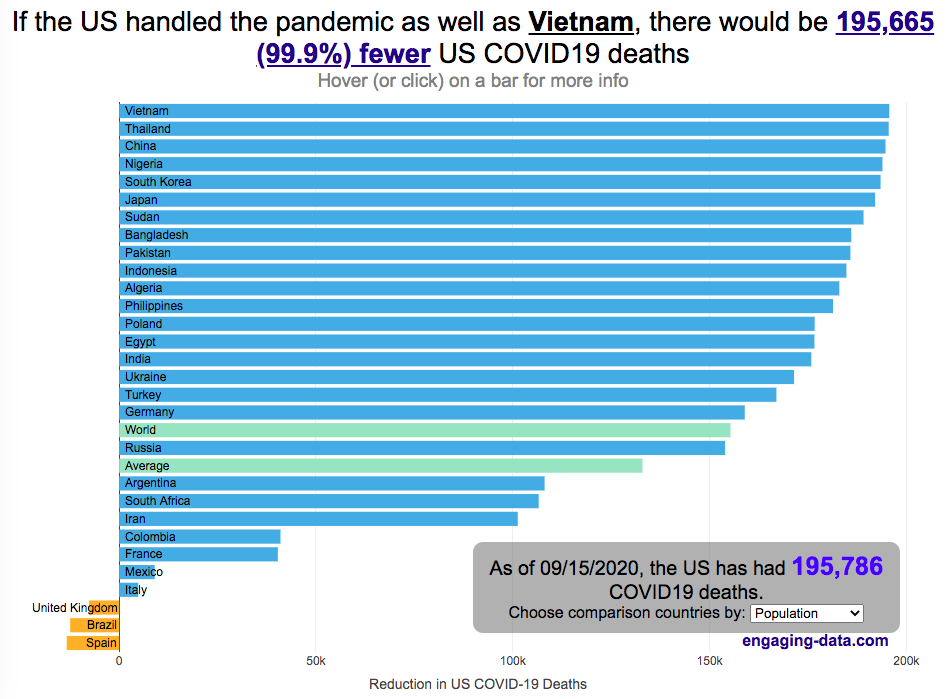
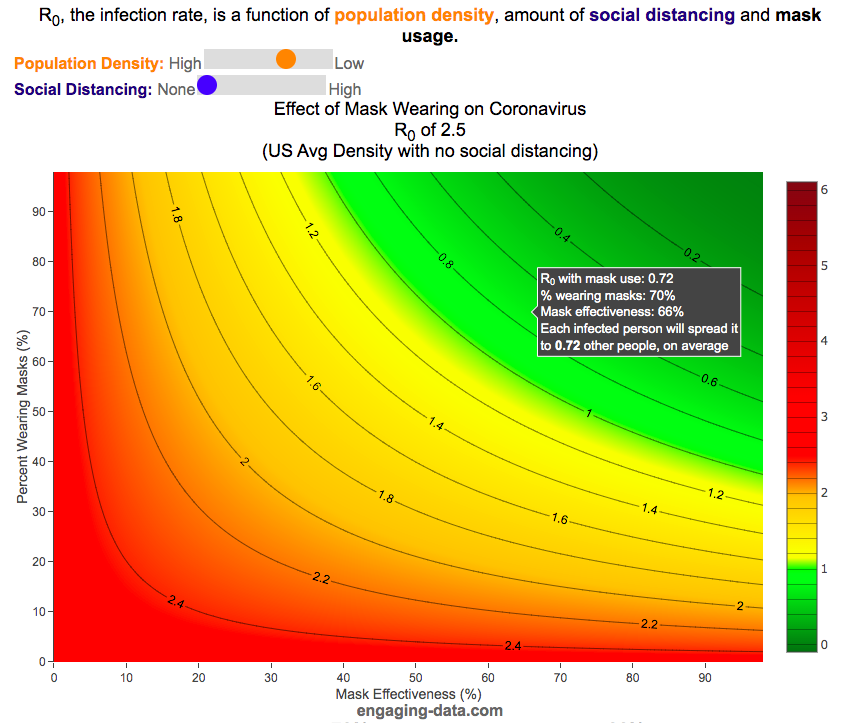
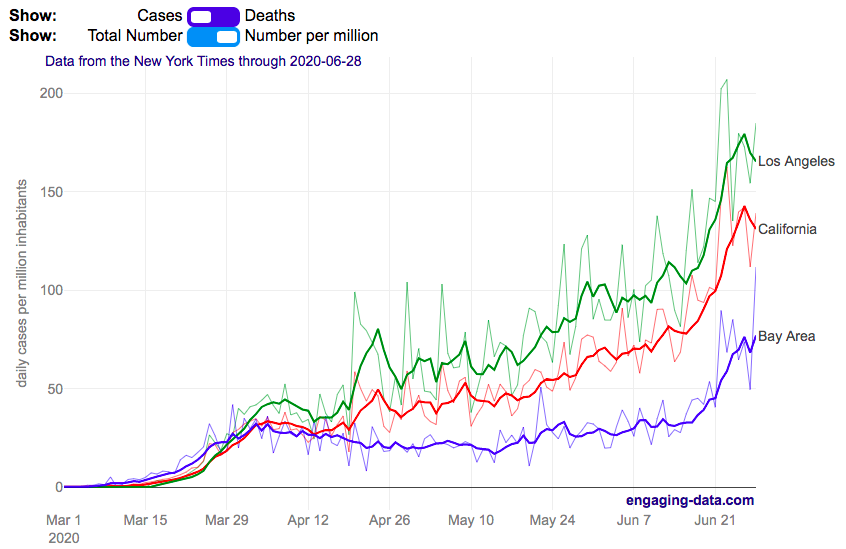
These visualizations focus on health including the coronavirus.
Here are some fun visualizations
Snake on a Globe
Stylish Text Font Generator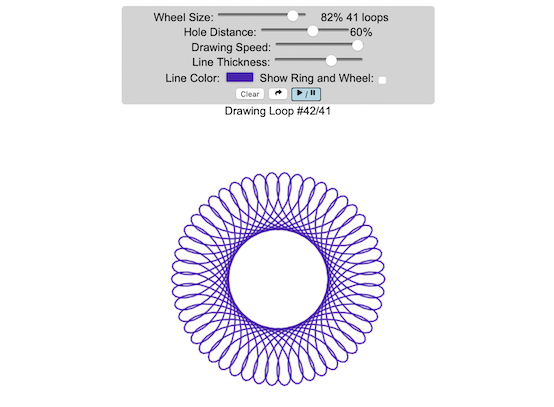
Interactive Spirograph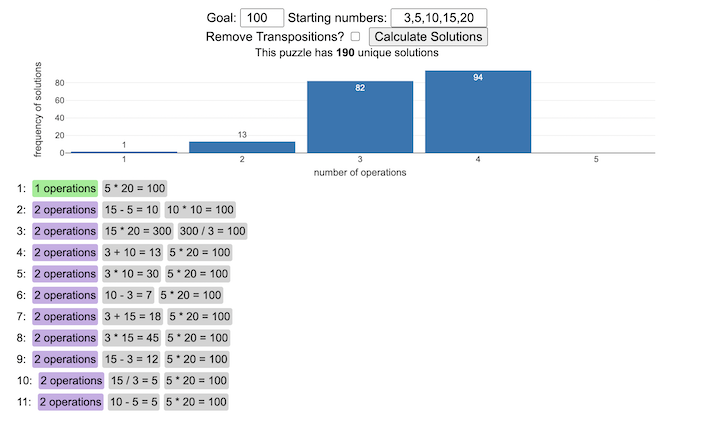
Digits Puzzle Solver
Digits Math Game
Wordle Guess Distribution
ScrabWordle
Tridle – Triple Wordle- WordGuessr Wordle clone
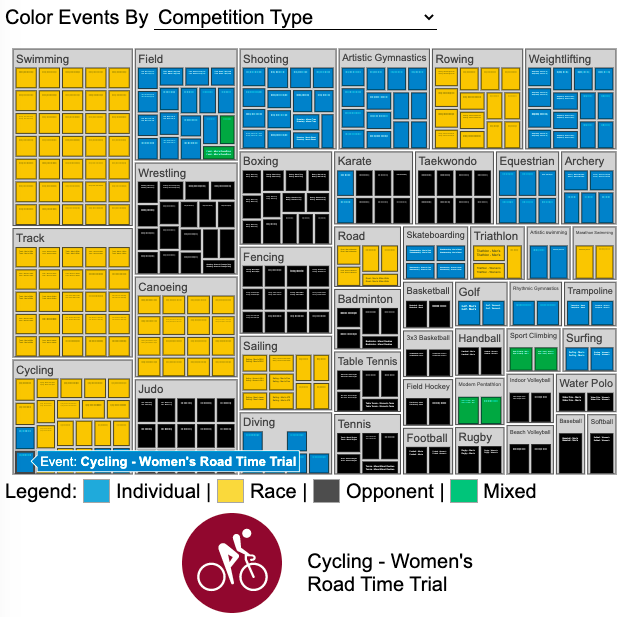
Visualizing Olympic Sports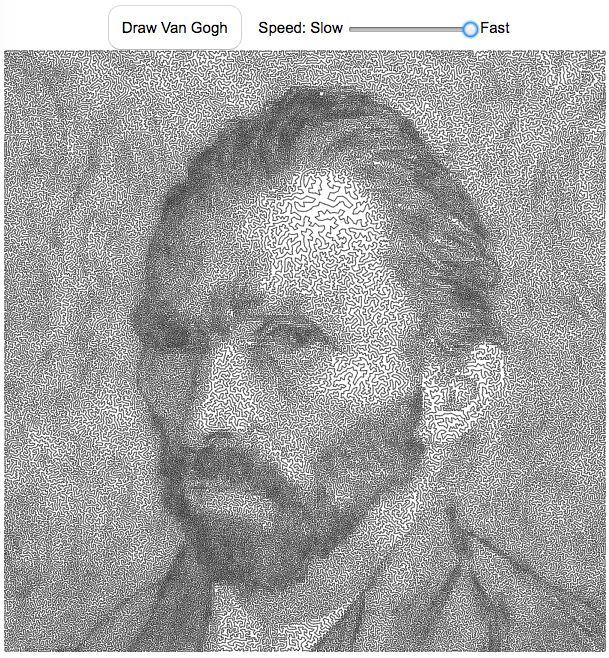
Van Gogh Traveling Salesman Art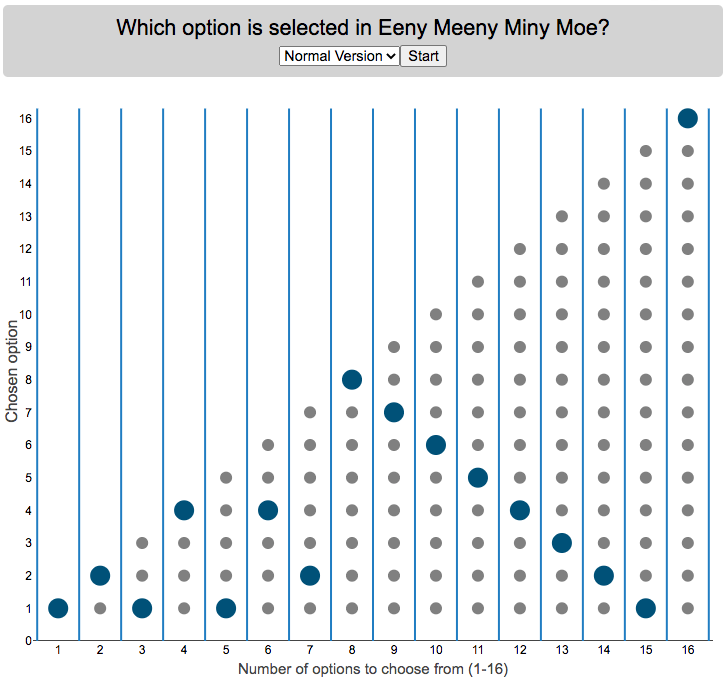
Outcome of Eeny Meeny Miney Moe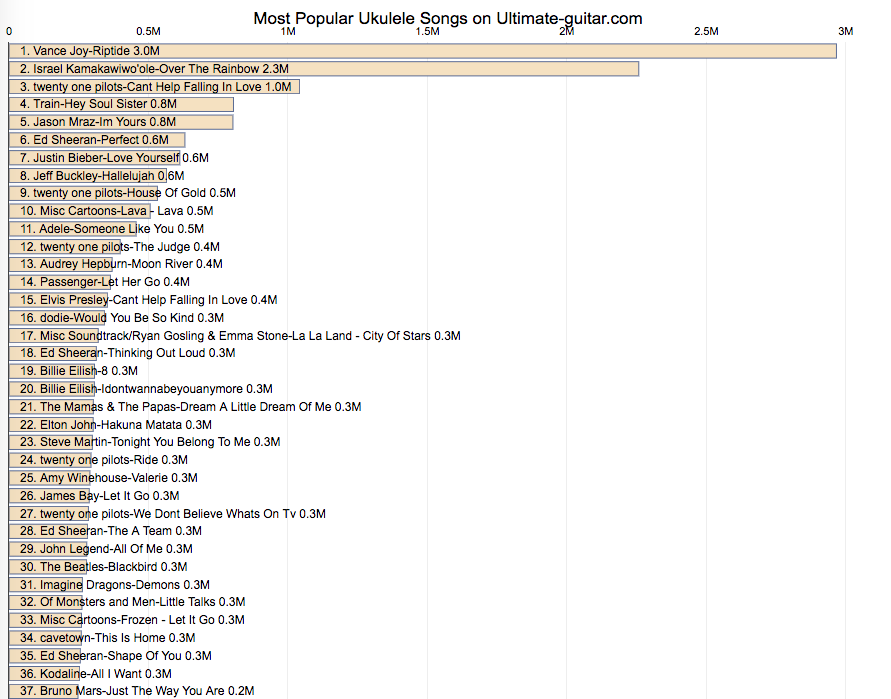
200 Popular Ukulele Songs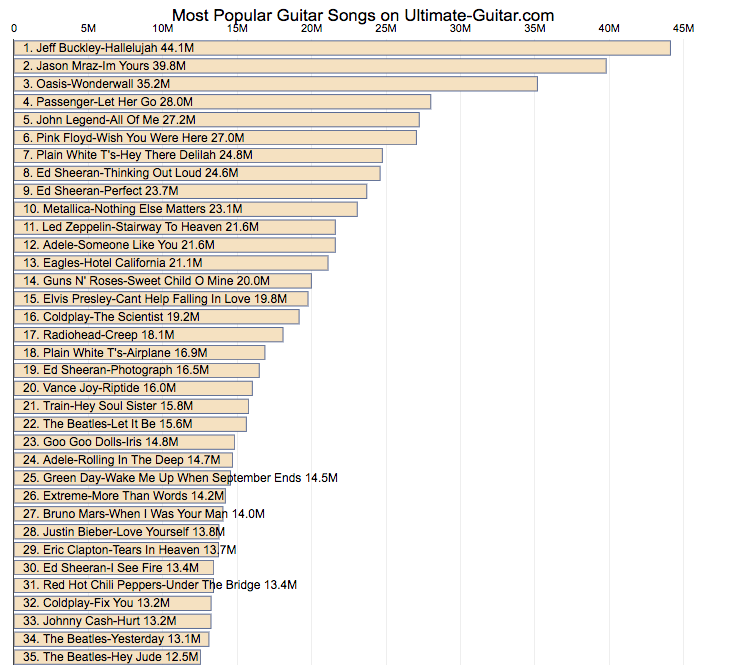
500 Popular Guitar Songs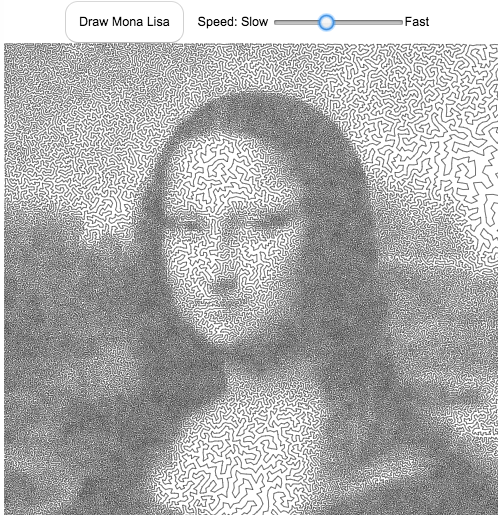
Mona Lisa Traveling Salesman Art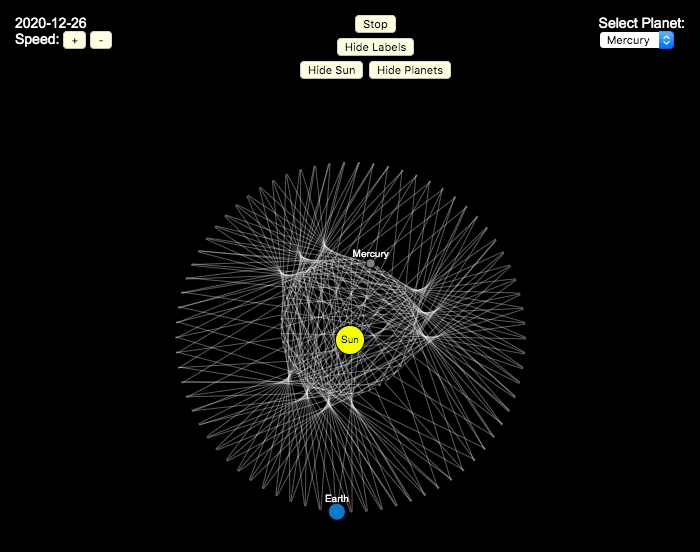 Planetary Spirograph
- Rubik’s cube world records over time
- Mercator country size distortion
- States re-sized to match population
- Antipodes map
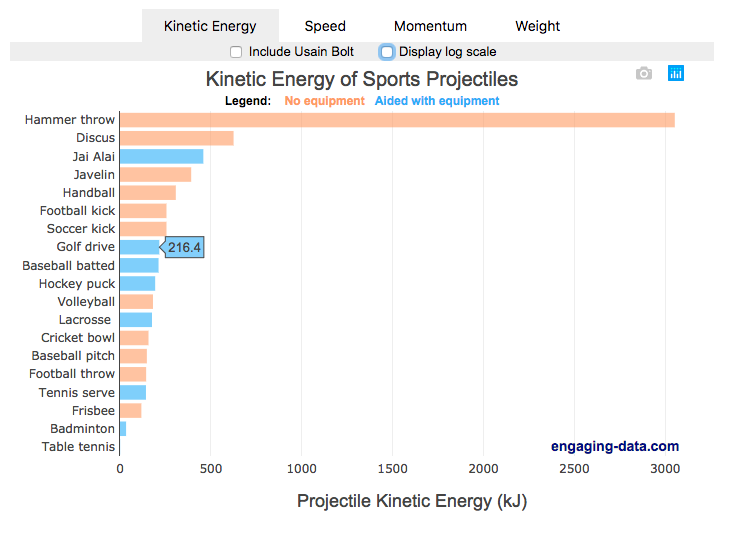 Speed and Energy in Sports Projectiles
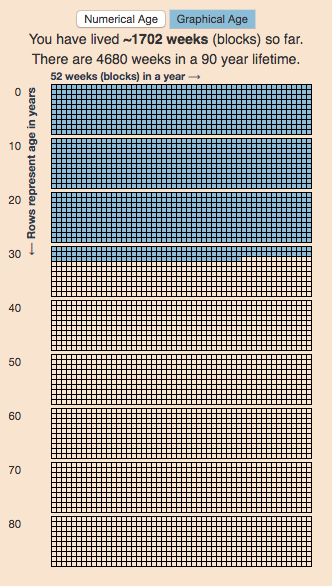
Age calculator and Lifespan Visualization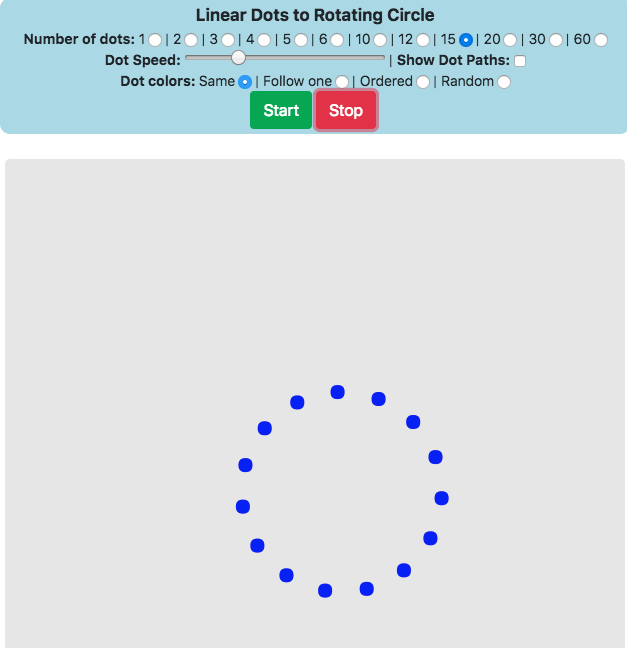
Dot illusion- How long does it take to count to one million?
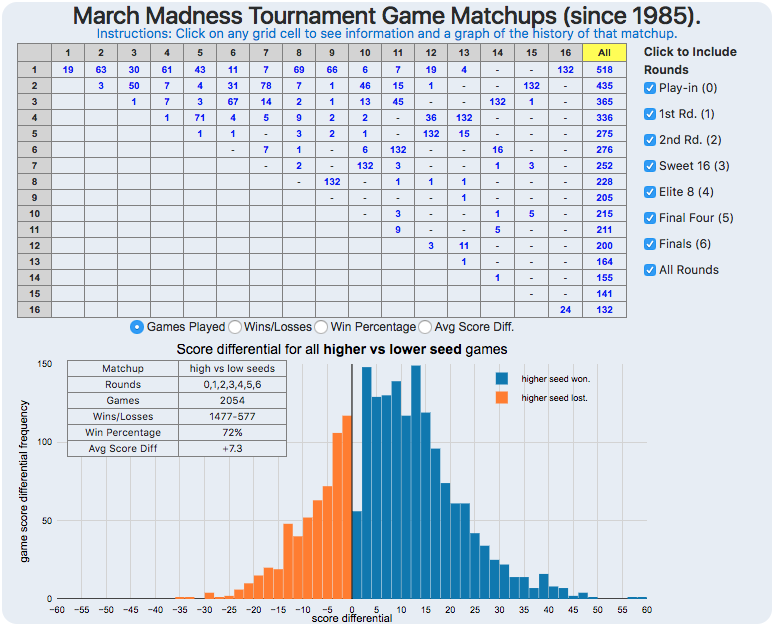 March madness matchup visualizer
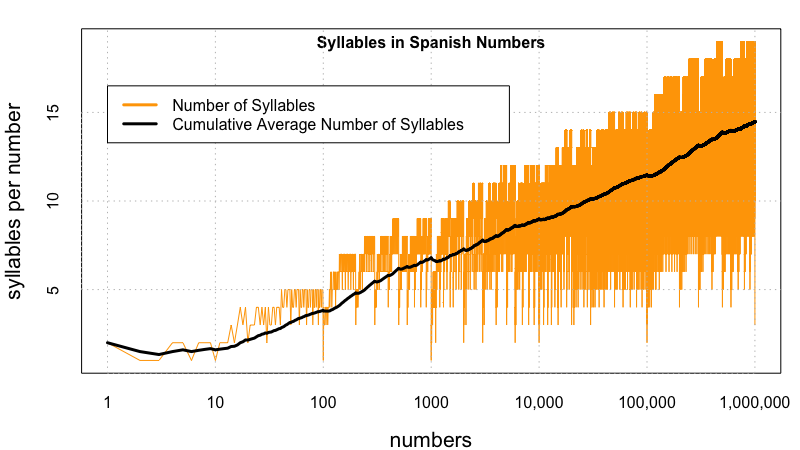 ¿Cuánto tardarías en contar hasta un millón?
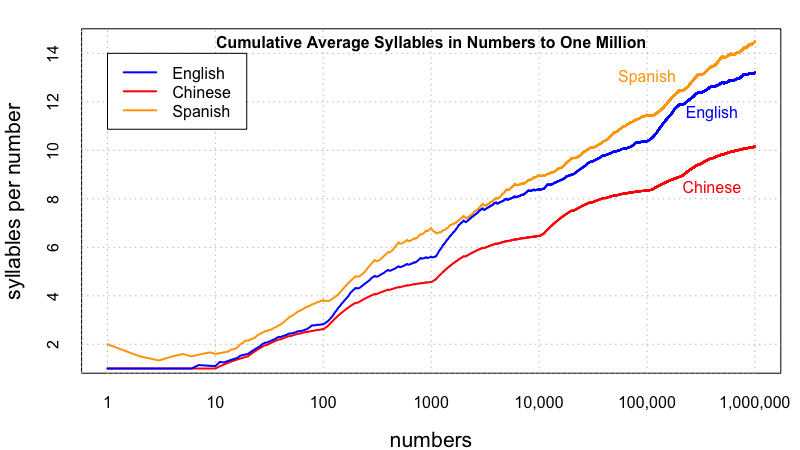 Counting to One Million in Different Languages (Chinese, English and Spanish)
These visualizations focus on demonstrating some mathematical or scientific topics.
Orbital Pattern of the International Space Station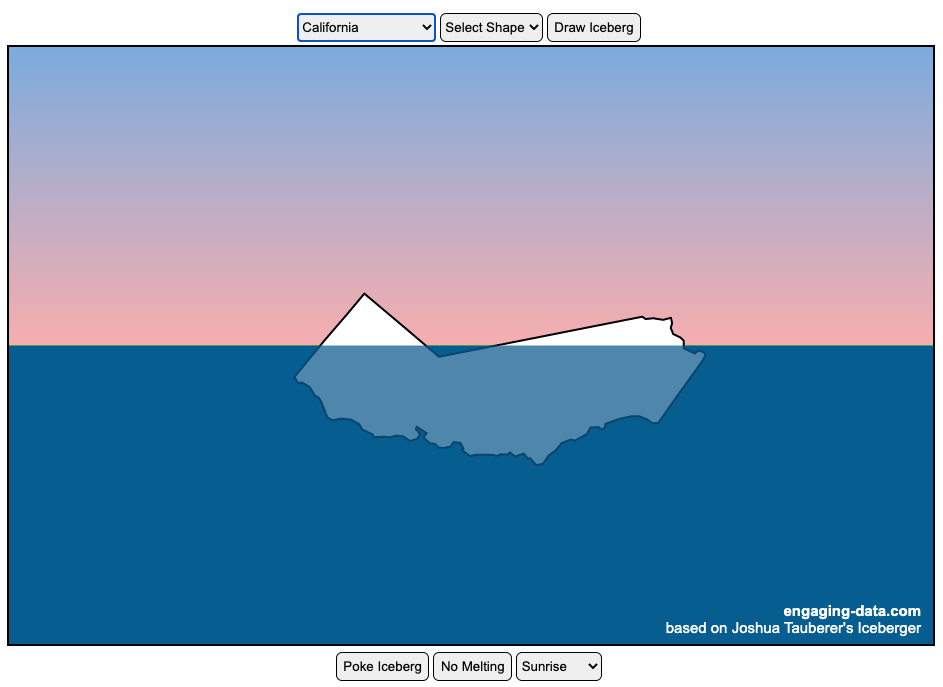
Iceberg Simulator
Mapping Countries onto Planets
Hours of Daylight by Latitude/Season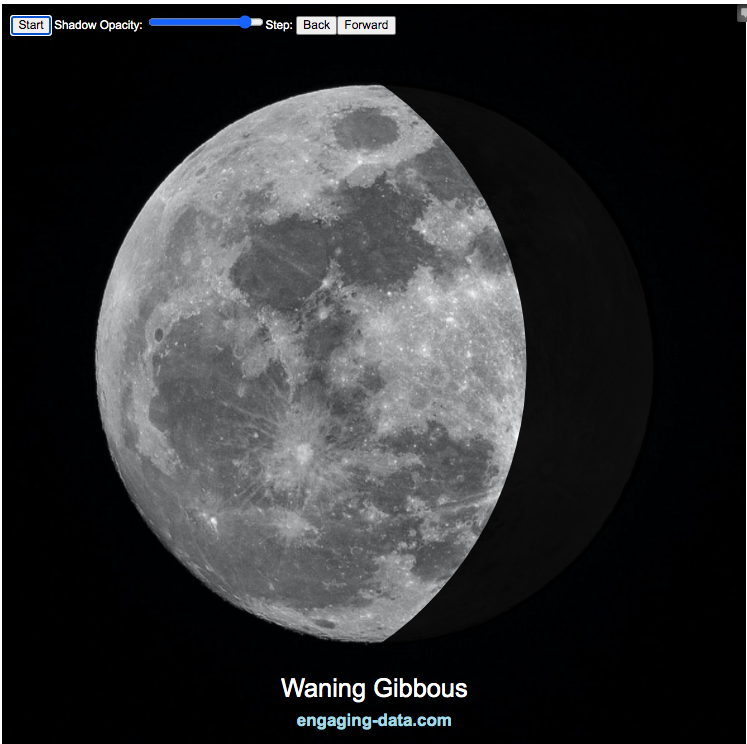
Moon Phases- Planetary Spirograph
Where is all the water on Earth?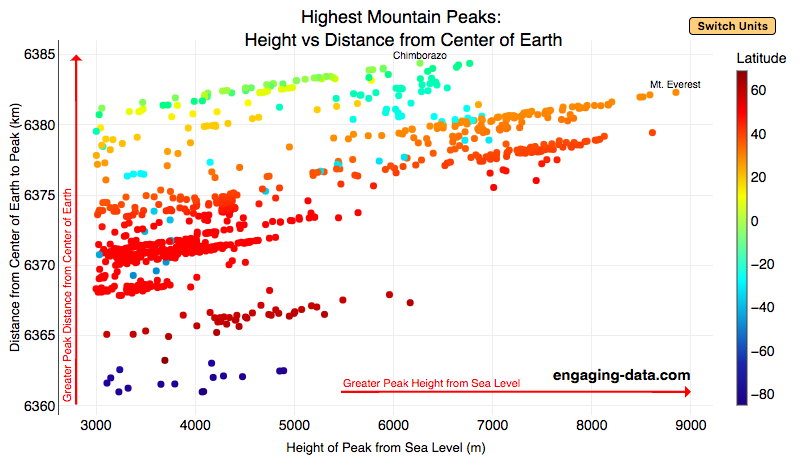 What is the Highest Mountain on Earth?
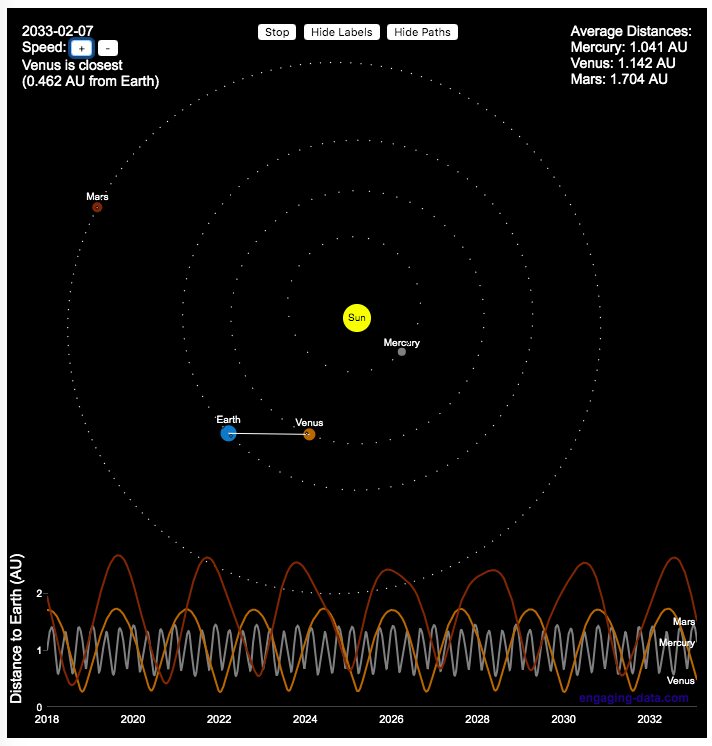
Mercury is closest planet to Earth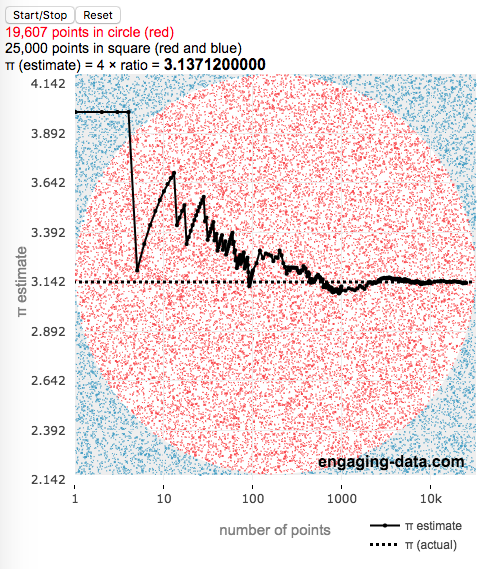
Estimating Pi with Monte Carlo
Solar Intensity By Location and Time
These visualizations don’t really have another home.