How many electoral votes did each state have across two centuries of elections?
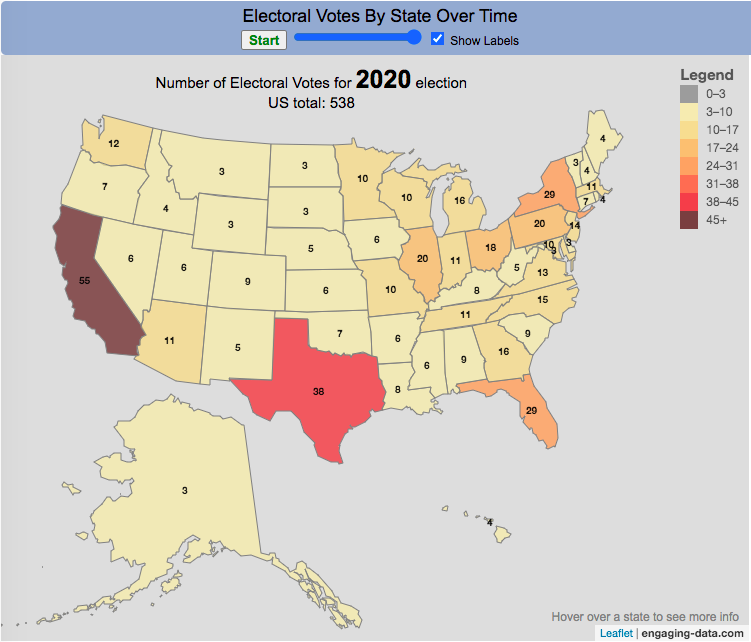
This animation shows the number of electoral votes each state had during each of the 59 presidential elections in US history between 1788 and 2020. It’s interesting to see the number of US states and their relative population sizes (in terms of electoral votes) over many different presidential elections. The population is counted every 10 years in the census so if a presidential election occurs between a census, it likely will not see any difference in numbers of electoral votes, unless something else happens (such as addition of a new state to the country).
Instructions
You can use the slider to control the election year to focus on a specific election and toggle the animation by hitting the Start/Stop button. Hovering over each state will tell you the number of electoral votes and the percentage of the total number of electoral votes in that election.
In the elections during and immediately after the US Civil War, we also see some states whose electoral votes for president are not counted (shown in purple). Wyoming, the state with the lowest population in the US, has the highest number of electoral votes per person in the state, while the three most populous states, California, Florida and Texas have the least number of electoral votes per person. Wyoming has four times the number of electors per capita than these 3 states have (i.e. accounting for their population sizes). That will be the subject of another map dataviz.
Sources and Tools:
Data on number of electoral votes by state for each election is from Wikipedia. And the visualization was created using javascript and the open source leaflet javascript mapping library.

Related Posts
No Comments »


