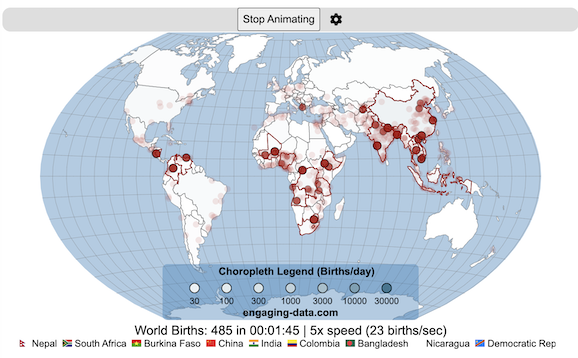
Where in the world are babies being born and how fast?
This interactive, animated map shows the where births are happening across the globe. It doesn’t actually show births in real-time, because data isn’t actually available to do that. However, the map does show the frequency of births that are occurring in different locations across the world. And you can see it in two ways, by country and also geo-referenced to specific locations (along a 1degree grid across the globe). There are many different ways to view this global birth map and these options are laid out in the controls at the top of the map. The scrolling list across the bottom also shows the country of each of the dots on the map.
Instructions
- Speed – change the slider to change the rate at which births show up on the map from real-speed to 25x faster
- Map projection – change the map projection
- Highlight country – an outline around the country when a birth occurs
- Choropleth – Build – as each birth occurs, the background color of the country will slowly change to reflect the number of births in the country
- Choropleth – Show – this option colors all the countries to show the number of births per day that occur in the country
- Dots – Show – this is the main feature that shows where each birth is occurring at the frequency that it does occur.
- Dots – Persist – this feature shows where previous births have occurred and the dots get darker as more births happen in that location.
If you hover (or click on mobile) on a country during the animation, it will display how many births have occurred since the animation stared.
Population distribution data combined with country birthrates
I used data that divided and aggregated the world’s population into 1 degree grid spacing across the globe and I assigned the center of each of these grid locations to a country. Then the country’s annual births (i.e. the country’s population times its birthrate) were distributed across all of the populated locations in each country, weighted by the population distribution (i.e. more populated areas got a greater fraction of the births).
Data Sources and Tools
Population and birthrate data for 2023 was obtained from Wikipedia (Population and birth rates). Population distribution across the globe was obtained from Socioeconomic Data and Applications Center (sedac) at Columbia University.
I used python to process country, population distribution data and parse the data into the probability of a birth at each 1 degree x 1 degree location. Then I used javascript to make random draws and predict the number of births for each map location. D3.js was used to create the map elements and html, css and javascript were used to create the user interface.
2 Comments »
2 Responses to Global Birth Map
Legal ficou bonito!
Do Topo do Mundo
Hi Chris, like everyone I’m very appreciative that you resuscitated Digits. It’s the very best of puzzles, an addictive workout for the brain.
Could we have one or two hard ones each day? By that I mean fewer than 200 solutions, ideally requiring a division. That would be fantastic!
Thanks again,
Anthony