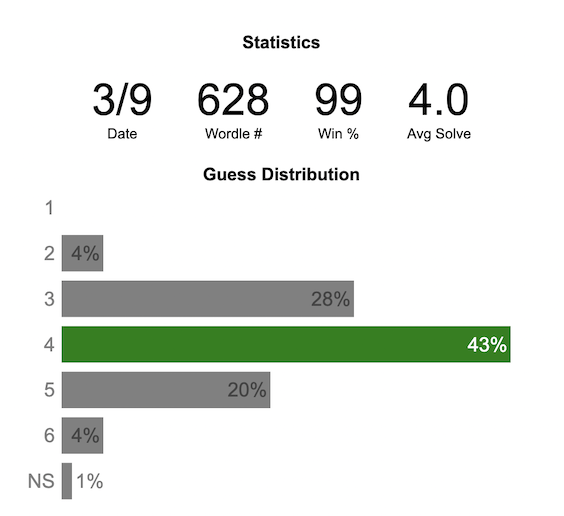
Update: Added a histogram below main graph to view the difficulty of today’s puzzle in context of historical data (compared to a number of previous puzzles)
What is today’s Wordle difficulty?
NY Times’ Wordle is a game of highs and lows. Sometimes your guesses are lucky (I mean, highly skilled) and you can solve the puzzle easily and sometimes you barely get it in 6 guesses. When the latter happens, sometimes you want validation that that day’s puzzle was hard. This dataviz lets you see how difficult today’s wordle puzzle was for other NY Times Wordle players did.
The graph shows the distribution of guesses needed to solve today’s Wordle puzzle, rounded to the nearest whole percent. It also colors the most common number of guesses to solve the puzzle in green and calculates the average number of guesses. “NS” stands for Not Solved. The lower histogram provides some context for how difficult the day’s puzzle is compared to many other puzzles in the past based on average number of guesses needed to solve the puzzle. It doesn’t include the entire history of wordle, but a subset of days that I was able to gather data on.
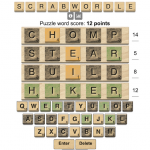
Even over 1 year later, I still enjoy playing Wordle. I even made a few Wordle games myself – Wordguessr – Tridle – Scrabwordle. I’ve been enjoying the Wordlebot which does a daily analysis of your game. I especially enjoy how it indicates how “lucky” your guesses were and how they eliminated possible answers until you arrive at the puzzle solution. One thing it also provides is data on the frequency of guesses that are made which provides information on the number of guesses it took to solve each puzzle.
Instructions
Data and Tools
The data comes from playing NY Times Wordle game and using their Wordlebot. Python is used to extract the data and wrangle the data into a clean format. Visualization was done in javascript and specifically the plotly visualization library.
35 Comments »
35 Responses to Wordle Stats – How Hard is Today’s Wordle?
Just realized the histogram changes between standard and hard mode statistics. Wonderful!
Haha, I got it in one… Update! My first!!
I just wanted to say thank you for making this. I check it every day to measure my dominance over the fellow members of the wordle community.
Could you explain the mathematics behind how you extract the data from Wordlebot?
not really any mathematics. In addition to the tips about solving wordle, Wordlebot also shows graphs with the likelihood of words being chosen in a sample of Wordle players. I just take this data and graph it. If you play using hard mode, it shows the data for a sample of users that played in hard mode.
What’s with the red typeface and asterisks all of a sudden?
Asterisks are to indicate that for that puzzle you can see the guess distribution for both standard mode and hard mode (in the drop-down menu)
Thank you for creating this, it was especially ego-salving today. Just curious, have you been keeping track of the record worst… and if so, did we just get a new one?
Hello. Would there be a way to put all the wordles into one chart, so that we could see the distribution of guesses globaly across all the wordles played so far?
I loved the insights you provided on the difficulty levels of today’s Wordle! It’s fascinating to see how the stats vary and what patterns emerge over time. Keep up the great work!
“Can you create an average distribution for all Wordle attempts? I’d like to compare how my average number of guesses compares over time. However, I’ve noticed that many articles on average guesses don’t account for losses properly—they exclude losses from the numerator but include them in the denominator, which skews the results in favor of failed attempts.”
Can you split the data out for those that play it the hard way vs the easy way?
Loved the visual representation of the stats! Really enjoyed seeing the progression of difficulty by category. Today’s challenge was tough, indeed
Is your data frozen? The last stats posted are for puzzle1185. The last 2 days aren’t showing.
Do you sample the Wordlebot data in hard-mode or standard mode? I notice that the Wordlebot hard-mode data I see has values for average guesses and Not Solved that are usually about 7% to 10% less than yours. Wordlebot says the numbered sampled is around 250K while you always say 1770K.
I was wondering if the difference is the mode or your 8 AM sampling time.
I have recently started playing Wordle. Are the results given out by the New York Times only for those subscribed or do they include those not subscribed but still play everyday. Cheers
Thank you so much for doing this. It’s great to be able to look at the stats for different words. Here’s another thing you could do that would be super cool: You could create a table with hundreds of rows, one row for each day/word. Then have columns for date, the word, win% and average solve. Then a user could quickly scan down and see how difficult different words were.
Thanks!
I noticed that the average score from the Wordlebot-derived averages appear NEVER to change, between 8AM and Midnight,(Pacific time).
Given a population close to 1.8 million, I would expect only very slight changes during the day. But there being NO changes at all surprises me.
Yes, the wordlebot data is only analyzed once a day at 8am Pacific time just so that there’s a very good representative number of people who already played the game.
Just for fun, I wrote a Wordle Guess Predictor which predicts the approximate ranges for the different guesses (2, 3, 4, 5, 6). For today, 4/5/2024, the prediction is [[ 2 25 40 24 4]] i.e. 40% would guess in 4 guesses (vs 39% of actual as depicted by you). I used the scikit multi output classifier and used the frequency distribution of letters to predict the outcome. You can view the source code at https://github.com/snandaca/wordlGuessPredictor if you are interested.
P.S. Thanks for the data for the guess distribution the last few months which I pulled down manually from your site to train the data.
Hi, do the No Solves get factored into the average in any way? Do you treat them as a 7?
It seems like it. For example, if you look back at Wordle 1012, the average is quoted as 4.5. That’s only possible if you assume the 8% of unsolved puzzles get scored a 7.
Would appreciate confirmation. Thanks!
Yes a no solve is averaged in as a 7.
Hi, many thanks for creating this site. I’ m looking for collective consolation after having a long run cruelled by “piper” (980, I think). A small suggestion please: perhaps when the number is called up, the answer for that day could appear, please? Eg call up 980, and the data set includes “piper”.
If you click on the eye symbol, beneath the statistics and above the guess distribution chart, you’ll see the word for that day.
Thanks for making this.
Can the previous puzzles be loaded just by changing the puzzle number in the meter?
Swift line here to say thank you. I can’t tell you how much this means to me and the family.
I love data, and I appreciate what you’ve done here! I check this page every time I do a Wordle, and I’ve even started jotting down the global averages in the notes I’ve been keeping about my results for the Wordles I do.
However, something seems very wrong today here: when I look at a day’s results more than once, the average solve score goes up slightly!
I don’t know if this problem existed before today, only that I didn’t notice it until today. I was perusing past data, specifically curious about which puzzles had higher-than-average average solve. I kept flipping back to compare new values to results I had already seen, and the numbers kept seeming oddly unfamiliar… but I brushed that aside, thinking it was just my abysmal working memory causing me grief, as usual.
Until I saw an average solve score greater than 6…! That’s when my programmers’ senses started tingling with delight, and I knew I had to investigate further and report it to you~!
What I found was this: most times, the average solve results only go up by +0.1 each time they’re viewed. This completely slipped under my radar, (and clearly everyone else’s as well) because the new values were still “ordinary”. The odd result that caught my attention was one that was increasing by more than 0.5 each time, which very quickly brought it outside the range of possible values.
After further investigation, I believe there may be a connection between the erroneous increase and the win percentage. Comparing two adjacent days’ results (789 and 790) with identical average solve score of 4.1 and win percentages of 98% and 99% respectively, the score for 789 climbs way faster than that of 790 upon repeated back-and-forth viewings of the two of them. Neither of these days had results that climbed anywhere near as fast as the one that caught my attention in the first place: puzzle 791 has a win percentage of 93%, and its average solve result leapt up by +0.6 upon second viewing.
Furthermore, on subsequent viewings after the second, the amount of increase seems slightly greater each time. Due to rounding, the change isn’t always immediately obvious, but it can be detected after a series of repeated viewings. Here are the average solve scores for the abovementioned puzzles, for a series of repeated views:
789 (wins: 98%): 4.1, 4.3, 4.4, 4.6, 4.9, 5.1, 5.4, 5.6, 5.9, 6.3, 6.6…
… … … … … … diff of 0.2, 0.1, 0.2, 0.3, 0.2, 0.3, 0.2, 0.3, 0.4, 0.3…
790 (wins: 99%): 4.1, 4.1, 4.2, 4.3, 4.4, 4.6, 4.7, 4.8, 5.0, 5.1, 5.3…
… … … … … … diff of 0.0, 0.1, 0.1, 0.1, 0.2, 0.1, 0.1, 0.2, 0.1, 0.2…
791 (wins: 93%): 5.1, 5.7, 6.3, 7.0, 7.8, 8.6, 9.5, 10.5, 11.5, 12.7…
… … … … … … diff of 0.6, 0.6, 0.7, 0.8, 0.8, 0.9, 1.0, 1.0, 1.2…
Fascinating, yes? Or is that just me? I’m tempted to play around further, which I imagine is a sign that I should get back into programming because I’m clearly itching to analyze and solve something… but I imagine there probably isn’t much more I can do from my end.
I wish you all the best in figuring out how to solve or bypass whatever the problem is!
Thanks again for providing such engaging data, both when it’s working, and when it was revealing a problem that I could enjoy analyzing for you~! 🙂
Qrystal, thanks for the very detailed bug report. I fixed the issue so the average score should be consistent no matter how many times you go back to the puzzle. The issue, if you want to know more, is that I had been calculating and adding the value of the last bar (for no solution) to the end of the array. But when you go back to the same, it adds it again which changed the average number of steps to solve the wordle. Anyway, I make sure to add it only once now. thanks again.
I appreciate you sharing what the problem had been; my curiosity is now sated.
Kudos on fixing it so quickly. 🙂 May your awesomeness serve you well.
I like it when community comes together to solve problems. Chris, thanks for making this and Qrystal, thanks for making it a little better. Code that works is good code, but there is nothing wrong with making good code better.
Hi. Just wanted to say thanks. I check this post every day, to see how I stack up. I’m incredibly average.
But I’m curious as to why it doesn’t always update properly. Sometimes (like today) it skips a day. Is there a way to see past updates?
Regardless, thanks again!
Sorry about that. Sometimes my server prevents files from being uploaded so the days puzzle data cannot be uploaded. I made a change that hopefully fixes the problem.
Hey no worries. Just curious. Thanks, man!
Can you create an average distribution for all Wordles? I like to see how my average number of guesses compares over time, but have found the calculation used within avg number of guesses articles doesn’t include losses in the numerator, but includes losses in the denominator which rewards failed attempts.