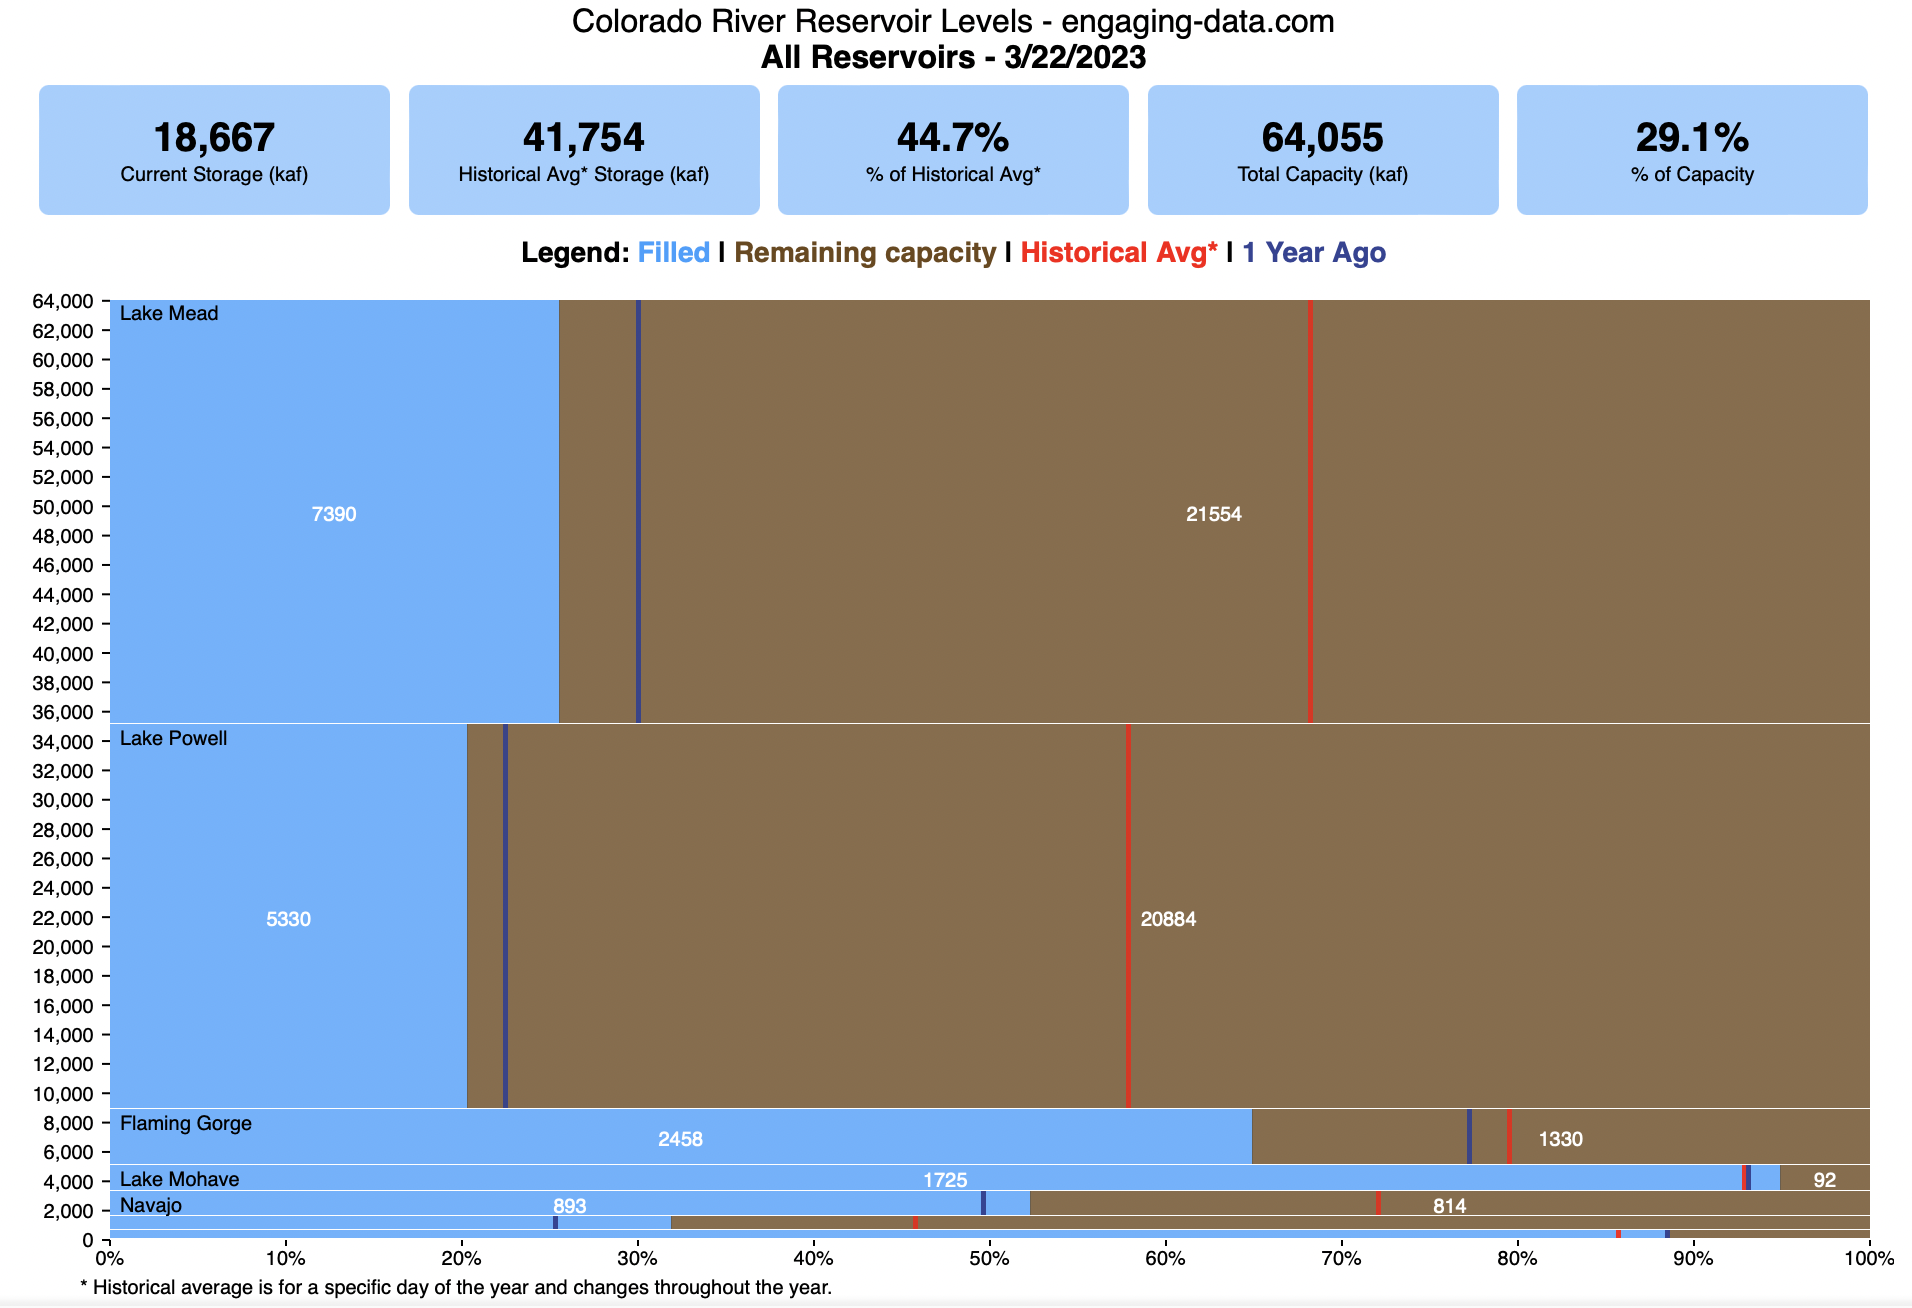
How much water is in the main Colorado River reservoirs?
Check out my California Reservoir Levels Dashboard
I based this graph off of my California Reservoir marimekko graph, because many folks were interested in seeing a similar figure for the Colorado river reservoirs.
This is a marimekko (or mekko) graph which may take some time to understand if you aren’t used to seeing them. Each “row” represents one reservoir, with bars showing how much of the reservoir is filled (blue) and unfilled (brown). The height of the “row” indicates how much water the reservoir could hold. Lake Mead is the reservoir with the largest capacity (at almost 29,000 kaf) and so it is the tallest row. The proportion of blue to brown will show how full it is. As with the California version of this graph, there are also lines that represent historical levels, including historical median level for the day of the year (in red) and the 1 year ago level, which is shown as a dark blue line. I also added the “Deadpool” level for the two largest reservoirs. This is the level at which water cannot flow past the dam and is stuck in the reservoir.
Lake Mead and Lake Powell are by far the largest of these reservoirs and also included are several smaller reservoirs (relative to these two) so the bars will be very thin to the point where they are barely a sliver or may not even show up.
Historical Data
Historical data comes from https://www.water-data.com/ and differs for each reservoir.
- Lake Mead – 1941 to 2015
- Lake Powell – 1964 to 2015
- Flaming Gorge – 1972 to 2015
- Lake Mohave – 1952 to 2015
- Lake Navajo – 1969 to 2015
- Blue Mesa – 1969 to 2015
- Lake Havasu – 1939 to 2015
The daily data for each reservoir was captured in this time period and median value for each day of the calendar year was calculated and this is shown as the red line on the graph.
Instructions:
If you are on a computer, you can hover your cursor over a reservoir and the dashboard at the top will provide information about that individual reservoir. If you are on a mobile device you can tap the reservoir to get that same info. It’s not possible to see or really interact with the tiniest slivers. The main goal of this visualization is to provide a quick overview of the status of the main reservoirs along the Colorado River (or that provide water to the Colorado).
Units are in kaf, thousands of acre feet. 1 kaf is the amount of water that would cover 1 acre in one thousand feet of water (or 1000 acres in water in 1 foot of water). It is also the amount of water in a cube that is 352 feet per side (about the length of a football field). Lake Mead is very large and could hold about 35 cubic kilometers of water at full (but not flood) capacity.
Data and Tools
The data on water storage comes from the US Bureau of Reclamation’s Lower Colorado River Water Operations website. Historical reservoir levels comes from the water-data.com website. Python is used to extract the data and wrangle the data in to a clean format, using the Pandas data analysis library. Visualization was done in javascript and specifically the D3.js visualization library.

15 Comments »
15 Responses to Colorado River Reservoir Levels
Hey, what happened to Lake Powell and Flaming Gorge? They’re coming up as empty.
I check the progress every day–but now, no data.
Thx for these amazing charts.
You’ve got a glitch on Flaming Gorge Reservoir on the Green River in Wyoming. Snoflo reports that today, 5/26/23, is is at 100% of historical levels, 2,818,705 a/f. Today, the chart is showing as empty. Thanks for your important work.
for some reason the data feed I’m using has it blank for the last couple of days. I changed the code so that it’ll read back a few days if the latest data is blank so the data might be up to a couple days old, but still more accurate than zero.
Here is link to David Fordham’s charts on Colorado reservoir and snow pack data.
https://www.water-data.com/
Kind of grim, but what about a black line for “dead pool” levels?
It would be nice to see the reservoir and snowpack data like you did for the California reservoir system.
I think the snowpack data can be retrieved from here: http://snowpack.water-data.com/uppercolorado/index.php
Not sure how “queryable” it is.
Would be interesting to see the historical averages for Colorado river reservoir levels. Is that something you might consider adding at some point?
Yes that was my intention but I haven’t found good historical data for each of the reservoirs yet.
Look here, Colorado river reservoir including daily historical data going back to when the dams were built. https://lakepowell.water-data.com/
From a quick glance, it looks to have all the data I would need. Thanks!
How often is this updated?
Should have been everyday, and I found the issue for why the data wasn’t updating. Thanks
Thank you for the excellent visuals of the data. Very helpful in understanding what is happening.
Things look good for the California reservoirs, but less so for Lake Mead. All the rain and snow of the past three months and it is still dropping in level. Very disappointing. Do you foresee any improvement? Can we expect snowpack melt to reach Lake Mead? Thank you.
It would need 5 to 7 years of these kinds of snowpacks to fill lake mead