How do current California rainfall and precipitation totals compare with Historical Averages?
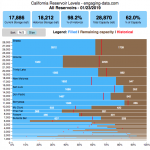
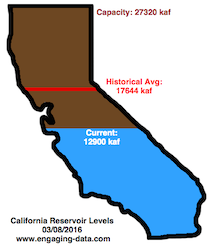
If you are lookin at this visualization, it’s likely winter in California and that means the rainy season (snowy in the mountains). I wanted to visualize how the current year compares with historical levels for this time of year. I used data for California rainfall totals from the California Department of Water Resources. Other California water-related visualizations include reservoir levels in the state as well.
There are three sets of stations that are tracked in the data and these plots:
- Northern Sierra 8-station index
- Tulare Basin 6-station index
- San Joaquin 5-station index
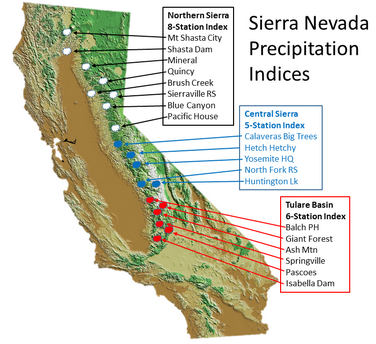
These stations are tracked because they provide important information about the state’s water supply (most of which originates from the Sierra Nevada Mountains). Data from the CDEC website appears to be updated at around 8:30am PST each day.
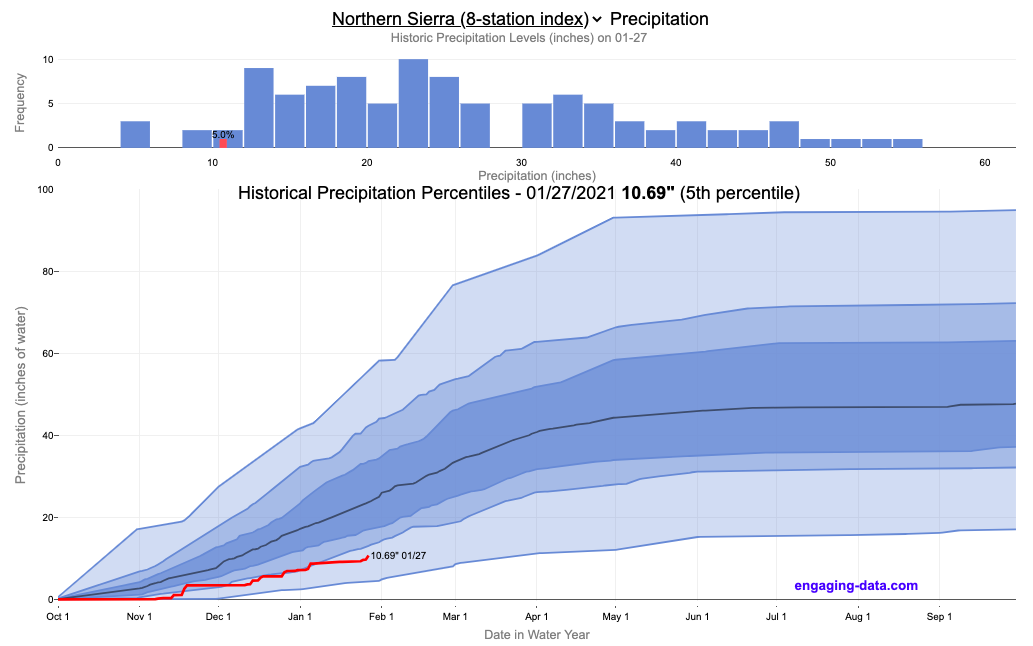
The visualization consists of two primary graphs both of which show the range of historical values for precipitation. The top graph is a histogram of water year precipitation totals on the specified date (in blue) as well as the precipitation total for the current water year in red.
The second graph shows the percentiles of precipitation over the course of the historical water year, spreading out like a cone from the start of the water year (October 1). You can see the current water year plotted on this to show how it compares to historical values. It also shows the present precipitation level and its percentile within the historical data for the day of the water year.
You can hover (or click) on the graph to audit the data a little more clearly.
Sources and Tools
Data is downloaded from the California Data Exchange Center website of the California Department of Water Resources using a python script. The data is processed in javascript and visualized here using HTML, CSS and javascript and the open source Plotly javascript graphing library.
16 Comments »
16 Responses to California Rainfall Totals
It’s true that a picture is worth a thousand words, so thank you!
I do have a request akin to Don Pyle’s: visualizations for more parts of the state beyond the three you already have. And, as a non-expert, I don’t know what land is included in “Tulare basin” and “San Joaquin.” Do you have a description to make those clear?
Excellent website, for both reservoirs and snowpack.
This is great! Just eye-balling it, looks like ~80% of the annual precip totals fall between 12″ – 40″. Statistically, I would call anything in that range “normal”, with the 10% on either end statistical outliers. Seems to be the nature of a semi-arid climate, some really dry years, some really wet years and anyone’s guess what you’ll get in between.
The second sentence in the write-up starts with “This has been a relatively dry year …”
I would like to know by what metric are you calling this year “a relatively dry year”.
The visualization was made a couple years ago, but I will change it to something generic so people won’t get confused.
I guessed so. Thanks for the great work 🙂
I happened upon this page, and I am in no way even a novice on this subject. I have lived here, Sacramento, most of my life. It says this year has been a relatively dry year. 2023 has not been dry, does this refer to 2022/2023 as the year? Current to date we are at 207% normal. Just trying to figure this out how to read/under this all. Thank you.
The information is extremely useful for a true understanding of California’s situation. On my page, the colored lines with the exception of the red current year and the black median line are all the same color blue. It may be my system but I think not.
Same here re coloured lines not showing (except red & black, as mentioned). This is great information, by the way.
Yes, the percentile lines are supposed to all be blue. The other colors in the legend are hidden by default but if you click on the lines in the legend, you can make them show up.
Thank you, Chris, for providing this data in such an up-to-date and easy to decipher form! I’ve been going to your site daily since I found it before the first big rainstorm of last week and the new one expected this week of January 1, 2023. With the years of drought, it’s been a joy to watch the daily increases in the reservoir water levels as this blessing of this atmospheric river has arrived. Thank you for your generous gift of your time to inform others!
I don’t have anything but gratitude and praise for the unpaid work you have done. The result is excellent. Please accept my thanks
Thank you and I’m glad you find it useful!
I would have liked to see a County by County, State map indicating the accumulation of Precipitation to date!
Thank you. This is exactly the visualization I was hoping existed where, even though my area is not included. Would be great to do the whole state (regions and total) and maybe a running 3 year agregate. It’s good to see the total over last, but I know that s a small part of of the big picture. Thanks again.
This history is great….Would be nice to know the number of years in the history…IMHO should be mentioned in the narrative