Posts for Tag: dashboard
California Rainfall Totals

How do current California rainfall and precipitation totals compare with Historical Averages?
If you are lookin at this visualization, it’s likely winter in California and that means the rainy season (snowy in the mountains). I wanted to visualize how the current year compares with historical levels for this time of year. I used data for California rainfall totals from the California Department of Water Resources. Other California water-related visualizations include reservoir levels in the state as well.
There are three sets of stations that are tracked in the data and these plots:
- Northern Sierra 8-station index
- Tulare Basin 6-station index
- San Joaquin 5-station index
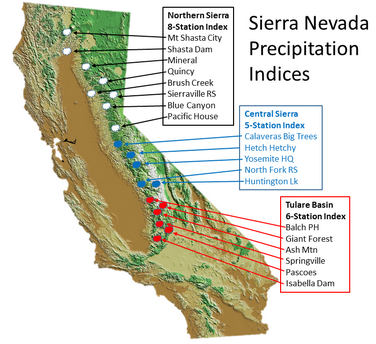
These stations are tracked because they provide important information about the state’s water supply (most of which originates from the Sierra Nevada Mountains). Data from the CDEC website appears to be updated at around 8:30am PST each day.
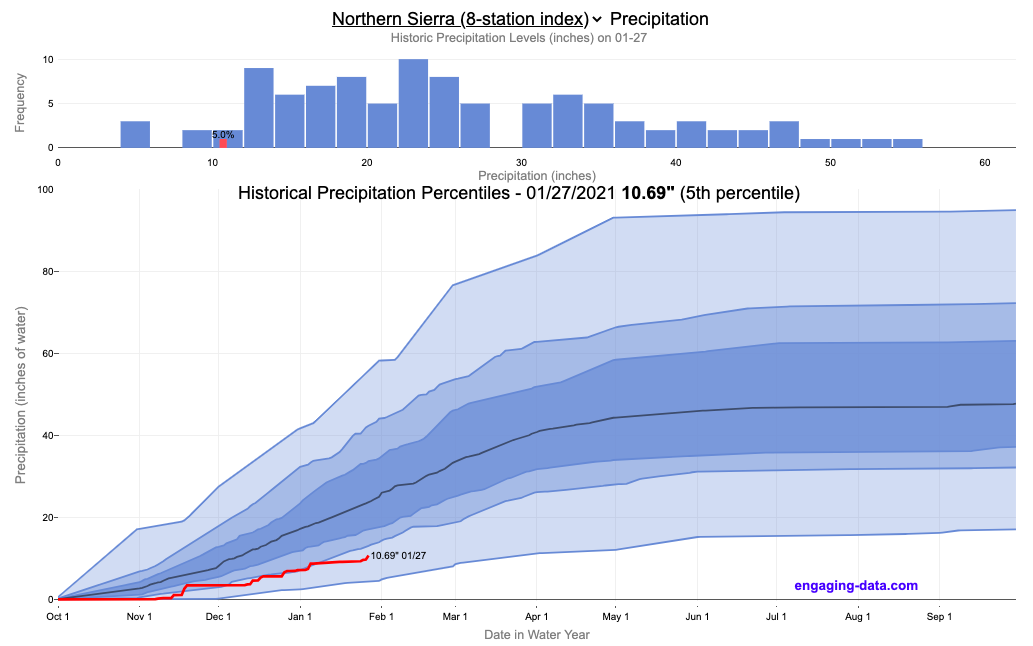
The visualization consists of two primary graphs both of which show the range of historical values for precipitation. The top graph is a histogram of water year precipitation totals on the specified date (in blue) as well as the precipitation total for the current water year in red.
The second graph shows the percentiles of precipitation over the course of the historical water year, spreading out like a cone from the start of the water year (October 1). You can see the current water year plotted on this to show how it compares to historical values. It also shows the present precipitation level and its percentile within the historical data for the day of the water year.
You can hover (or click) on the graph to audit the data a little more clearly.
Sources and Tools
Data is downloaded from the California Data Exchange Center website of the California Department of Water Resources using a python script. The data is processed in javascript and visualized here using HTML, CSS and javascript and the open source Plotly javascript graphing library.
California Rainfall Totals
How do current California rainfall and precipitation totals compare with Historical Averages?
If you are lookin at this visualization, it’s likely winter in California and that means the rainy season (snowy in the mountains). I wanted to visualize how the current year compares with historical levels for this time of year. I used data for California rainfall totals from the California Department of Water Resources. Other California water-related visualizations include reservoir levels in the state as well.
There are three sets of stations that are tracked in the data and these plots:
- Northern Sierra 8-station index
- Tulare Basin 6-station index
- San Joaquin 5-station index
These stations are tracked because they provide important information about the state’s water supply (most of which originates from the Sierra Nevada Mountains). Data from the CDEC website appears to be updated at around 8:30am PST each day.
The visualization consists of two primary graphs both of which show the range of historical values for precipitation. The top graph is a histogram of water year precipitation totals on the specified date (in blue) as well as the precipitation total for the current water year in red.
The second graph shows the percentiles of precipitation over the course of the historical water year, spreading out like a cone from the start of the water year (October 1). You can see the current water year plotted on this to show how it compares to historical values. It also shows the present precipitation level and its percentile within the historical data for the day of the water year.
You can hover (or click) on the graph to audit the data a little more clearly.
Sources and Tools
Data is downloaded from the California Data Exchange Center website of the California Department of Water Resources using a python script. The data is processed in javascript and visualized here using HTML, CSS and javascript and the open source Plotly javascript graphing library.
Recent Comments