How much water is stored in California’s snowpack and reservoirs?
California’s snow pack is essentially another “reservoir” that is able to store water in the Sierra Nevada mountains. Graphing these things together can give a better picture of the state of California’s water and drought.
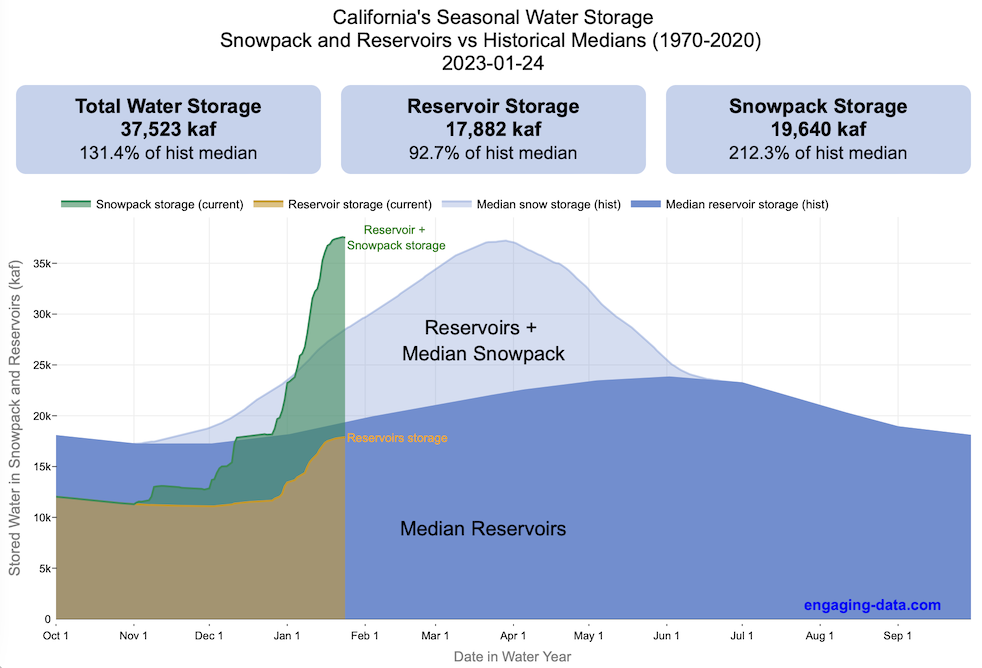
The historical median (i.e. 50th percentile) for snow pack water content is stacked on top of the median for reservoirs storage (shown in two shades of blue). The current water year reservoirs is shown in orange and the current year’s snow pack measurement is stacked on top in green. What is interesting is that the typical peak snow pack (around April 1) holds almost as much water (about 2/3 as much) as the reservoirs typically do. However, the reservoirs can store these volumes for much of the year while the snow pack is very seasonal and only does so for a short period of time.
Snowpack is measured at 125 different snow sensor sites throughout the Sierra Nevada mountains. The reservoir value is the total of 50 of the largest reservoirs in California. In both cases, the median is derived from calculating the median values for each day of the year from historical data from these locations from 1970 to 2021.
I’ve been slowly building out the water tracking visualizations tools/dashboards on this site. And with the recent rains (January 2023), there has been quite a bit of interest in these visualizations. One data visualization that I’ve wanted to create is to combine the precipitation and reservoir data into one overarching figure.
Creating the graph
I recently saw one such figure on Twitter by Mike Dettinger, a researcher who studies water/climate issues. The graph shows the current reservoir and snowpack water content overlaid on the historic levels. It is a great graph that conveys quite a bit of info and I thought I would create an interactive version of these while utilizing the automated data processing that’d I’d already created to make my other graphs/dashboards.
Time for another reservoirs-plus-snowpack storage update….LOT of snow up there now and the big Sierra reservoirs (even Shasta!) are already benefitting. Still mostly below average but moving up. Snow stacking up in UCRB. @CW3E_Scripps @DroughtGov https://t.co/2eZgNArahy pic.twitter.com/YEH4IYKlnH
— Mike Dettinger (@mdettinger) January 15, 2023
The challenge was to convert inches of snow water equivalent into a total volume of water in the snowpack, which I asked Mike about. He pointed me to a paper by Margulis et al 2016 that estimates the total volume of water in the Sierra snowpack for 31 years. Since I already had downloaded data on historical snow water equivalents for these same years, I could correlate the estimated peak snow water volume (in cubic km) to the inches of water at these 120 or so Sierra snow sensor sites. I ran a linear regression on these 30 data points. This allowed me to estimate a scaling factor that converts the inches of water equivalent to a volume of liquid water (and convert to thousands of acre feet, which is the same unit as reservoirs are measured in).
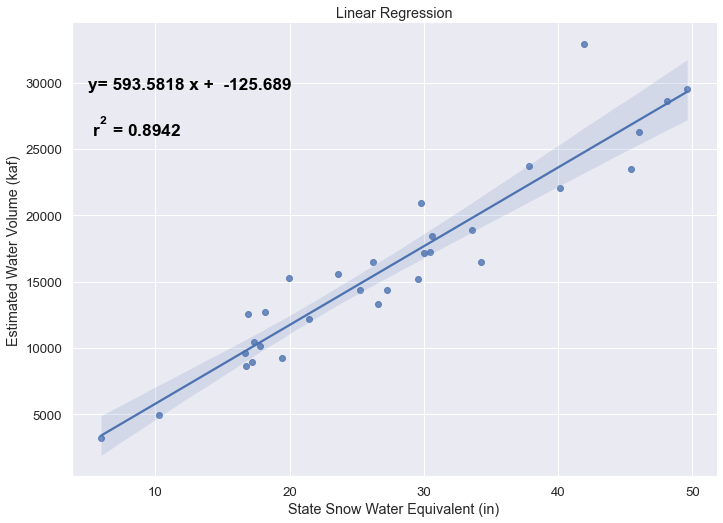
This scaling factor allows me to then graph the snowpack water volume with the reservoir volumes.
See my snowpack visualization/post to see more about snow water equivalents.
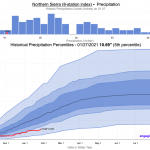
My numbers may differ slightly from the numbers reported on the state’s website. The historical percentiles that I calculated are from 1970 until 2020 while I notice the state’s average is between 1990 and 2020.
You can hover (or click) on the graph to audit the data a little more clearly.
Sources and Tools
Data is downloaded from the California Data Exchange Center website of the California Department of Water Resources using a python script. The data is processed in javascript and visualized here using HTML, CSS and javascript and the open source Plotly javascript graphing library.
28 Comments »
28 Responses to Visualizing California’s Water Storage – Reservoirs and Snowpack
Are you going to reset these charts for the now-started 2023-24 water year? So far it’s only showing last year’s data and we’ve already had some rain. Thanks!
It would be awesome if this year’s data only removes year-old data so we can watch this year’s graph compared to last year’s.
FYI, the summary numbers in the top 3 boxes do not appear to be changing after Aug. 1st.
Please excuse my densitudinosity, but I am confused by the nomenclature on the Reservoirs and Snowpack charts. Is “median” what you really mean for the water years rather than average? I thought median means the middle score with half the scores higher and half lower, while average or mean means the sum of data points divided by the number of data points. Isn’t the amount of water over the average that should be of interest here? Over the median seems merely a factoid to me. Again, sorry if I am not understanding. Thanks for your hard work producing the charts.
Enhancement request for your graph of reservoirs + snowpack.
You might consider adding a line for maximum reservoir capacity, and maybe a line for 75% (or some other percentage)?
Just a thought. It’s a great graph.
Reservoir Storage- “% of peak (3/1)”. Shouldn’t that read “% of peak (6/1)” instead?
Thanks. Yes, it was a bug in my code. Fixed it so now it says 5/31.
Love this stuff. But is the snow pack storage right? It shows 223.1% for both of median and peak. And was that peak March 1921?
The 3/21 peak shown for snowpack is the peak of the median snowpack curve which occurs on March 21st.
really enjoy seeing your work… gives clear information.
Great visualization. Could you add the ability to click on and off historical years for reference on the res+snowpack plot?
I love these charts. There is so much positive and negative hype in the media about water so its great to find a factual source. I have a question about the snowpack storage numbers. Is this the total water content in all the snowpack, or just the water content that will eventually be captured in reservoirs?
From someone who loves charts – THANK YOU for this comprehensive comparison. So frustrating seeing news reports that selectively compare different months or years for dramatic effect. This is really helpful to know where we were and where we are.
Is an historic percentile view of Total Water Storage possible, in the format of the precipitation and snowpack visualizers? This graph gives a comparison to average but not the insight to the historic range of the other format.
I have become a big fan of your charts! The one I always look up is the San Luis reservoir since that’s the closest large one. Sometimes several times a day and get thrilled when I see an increase!
Very nice visualizer but the green shaded area is confusing. I can see and verify by the numbers that it is totaling snowpack + reservoir but the legend shows it as snowpack only.
Where is the actual snowpack level, isolated by itself, on the visualizer?
There isn’t an isolated view of the snowpack only on this graph. The green shaded area is always shown on top of the reservoir level (in orange). However, if you want to see snowpack in more detail, you can see that here: https://engaging-data.com/california-snowpack-levels/
Very nice work. I am quite sure it is lots of works.
1. Just curious where you get the data from
2. In the California reservoir level website, you are using average. Here you switched over to median. Any particular reasons?
Data is from California’s Department of Water Resources page. https://cdec.water.ca.gov
On the California reservoir page, I was just pulling the average value directly from the CDEC website, which reports the average. In my snowpack visualization, I went about calculating the median (and other percentiles) from the historical data, so I’m just reusing that data.
Appreciate the effort to create this chart. Curious why the Reservoir Storage number on this chart do not match the numbers on your CA Reservoir Dashboard? What reservoirs are included on this chart versus the “total” on the dashboard?
Thanks,
Nice work but I echo the request to show the portion of snowpack that will end up in reservoirs! That’s what we selfishly care about! It would inform us of the true water supply situation.
That is an impossible request. The portion of the snowpack that will end up in the reservoirs is dependent on many factors that cannot be predicted, including how dry the top layers of soil are in the months ahead, and the mean temperature in the months ahead.
Oh … Well now I feel stupid for asking. But! Any idea on the *range* of percentages of snow pack that ends up in reservoirs? I mean even rough estimates?
Incredible work yet again. Thanks so much for all your time on these graphs!
I enjoy your work and look forward to opening your pages to see what is happening with water in the state. I am still puzzled by outflows exceeding the inflows at some dams (especially Folsom) as the weather has been very unpredictable. Thank you for taking the time to accumulate the data and visually prepare an easily understandable set of charts.
This is great! Do you have any idea how to estimate the % of the snowpack that will ultimately end up in reservoirs?
This is so cool, thank you!
Really well done, thank you.