Posts for Tag: California
California is World’s 4th Largest Economy

This is one of an ongoing series of visualizations about the state of California. This one is about the state’s economy, which recently moved into 4th place (2024), if California were its own country. It is, however, still part of the United States.
The visualization shows the relative sizes of the top 10 world economies (including the US, with California removed for context). California has the smallest population of any of the top 10, with #9 Canada just barely larger than California in population, though with a significantly smaller sized economy (about 1/2 the size).
Hover over the countries to see their GDP and population. California is behind the United States, China and Germany in total economic output (in nominal terms), but ahead of much larger countries Japan and India and the United Kingdom.
The state’s economy produces $4.1 Trillion dollars of economic output, driven by a range of industries including technology, real estate, manufacturing, agriculture and health care. It is a hub for innovation and entrepreneurship. California is also the leading agricultural state in the United States. Immigration is a huge part of the state’s workforce.
Sources and Tools:
2024 economic data was downloaded from the International Monetary Fund (IMF). This visualization is made using d3.js, an open-source javascript visualization library.

University of California Admission Rates by Major

Which majors are most competitive across the University of California system?
The University of California consists of nine campuses with undergraduate programs and they are all ranked among the best universities in the US (according to US News). All nine rank within the top 45 public schools including #1 and #2 and top 85 national universities in the US.
This data visualization focuses on the acceptance rates for students based on their indicated preferred majors in their application to the various University of California campuses in the Fall of 2023 admissions cycle. When you apply to a given university campus, you need to specify a major and this choice can affect the student’s chances of getting accepted, especially if the major is very sought after. Subjects like computer science are very popular and as a result, the data shows that most campuses have a lower acceptance rate for computer science as compared to the university as a whole.
Data visualization
The graph shown in the data visualization is a marimekko graph which shows a percentage based bar graph showing the acceptance rate (in blue) for a given major at a given university. The height of each horizontal bar is proportional to the number of applicants to that major, so taller bars have more applicants vs bars that are shorter. If you hover over (or click on mobile) a bar, it provides more information about the acceptance rate, enrollment rate (i.e. yield rate) and the GPA of accepted students. You can choose to sort the graph by subject name, admit rate or number of applicants.
The data visualization can help you explore different campuses and major categories. If you are viewing “School View“, you can see how the various disciplines compare for a single university at one time. Whereas if you view “Subject View” you can see the comparison of a single discipline across the University campuses that offer those majors.
The University of California has over 240,000 undergraduate students and extends about 140,000 acceptances to fill out 42,000 slots for first year students. There is a significant amount of overlap as most students applying for admission apply to several campuses, and many students get accepted to multiple campuses.
The broad disciplines used in the visualization are composed of a number of individual majors and these are detailed in the table below.
GPA calculation
The University of California only considers grades from 10th grade and 11th grade for admissions decisions, and uses a weighted system where honors and AP classes are given an extra point in GPA calculations above the normal A=4, B=3, C=2, etc. . GPA calculation. So for an honors math class, for example, an A would be worth 5 points.
Sources and Tools:
Data comes directly from the University of California website for the fall of 2023, which has quite a bit of interesting data about students and admissions. I downloaded the data and processed it with python to organize it. The webtool is made using javascript, HTML and CSS and graphed using the open-source plotly graphing library.
Table of Disciplines to majors
This table lists the specific areas and majors that make up the broad disciplines shown in the data visualization.
Broad discipline
CIP Family Title
CIP Subfamily Title
Architecture
ARCHITECTURE AND RELATED SERVICES
Architecture.
Architecture
ARCHITECTURE AND RELATED SERVICES
City/Urban, Community, and Regional Planning.
Architecture
ARCHITECTURE AND RELATED SERVICES
Environmental Design.
Architecture
ARCHITECTURE AND RELATED SERVICES
Landscape Architecture.
Architecture
ARCHITECTURE AND RELATED SERVICES
Real Estate Development.
Arts & Humanities
FOREIGN LANGUAGES, LITERATURES, AND LINGUISTICS
Linguistic, Comparative, and Related Language Studies and Services.
Arts & Humanities
FOREIGN LANGUAGES, LITERATURES, AND LINGUISTICS
African Languages, Literatures, and Linguistics.
Arts & Humanities
FOREIGN LANGUAGES, LITERATURES, AND LINGUISTICS
East Asian Languages, Literatures, and Linguistics.
Arts & Humanities
FOREIGN LANGUAGES, LITERATURES, AND LINGUISTICS
Slavic, Baltic and Albanian Languages, Literatures, and Linguistics.
Arts & Humanities
FOREIGN LANGUAGES, LITERATURES, AND LINGUISTICS
Germanic Languages, Literatures, and Linguistics.
Arts & Humanities
FOREIGN LANGUAGES, LITERATURES, AND LINGUISTICS
Romance Languages, Literatures, and Linguistics.
Arts & Humanities
FOREIGN LANGUAGES, LITERATURES, AND LINGUISTICS
Middle/Near Eastern and Semitic Languages, Literatures, and Linguistics.
Arts & Humanities
FOREIGN LANGUAGES, LITERATURES, AND LINGUISTICS
Classics and Classical Languages, Literatures, and Linguistics.
Arts & Humanities
FOREIGN LANGUAGES, LITERATURES, AND LINGUISTICS
Celtic Languages, Literatures, and Linguistics.
Arts & Humanities
FOREIGN LANGUAGES, LITERATURES, AND LINGUISTICS
Foreign Languages, Literatures, and Linguistics, Other.
Arts & Humanities
ENGLISH LANGUAGE AND LITERATURE/LETTERS
English Language and Literature, General.
Arts & Humanities
ENGLISH LANGUAGE AND LITERATURE/LETTERS
Rhetoric and Composition/Writing Studies.
Arts & Humanities
ENGLISH LANGUAGE AND LITERATURE/LETTERS
Literature.
Arts & Humanities
ENGLISH LANGUAGE AND LITERATURE/LETTERS
English Language and Literature/Letters, Other.
Arts & Humanities
LIBERAL ARTS AND SCIENCES, GENERAL STUDIES AND HUMANITIES
Liberal Arts and Sciences, General Studies and Humanities.
Arts & Humanities
PHILOSOPHY AND RELIGIOUS STUDIES
Philosophy.
Arts & Humanities
PHILOSOPHY AND RELIGIOUS STUDIES
Religion/Religious Studies.
Arts & Humanities
VISUAL AND PERFORMING ARTS
Visual and Performing Arts, General.
Arts & Humanities
VISUAL AND PERFORMING ARTS
Dance.
Arts & Humanities
VISUAL AND PERFORMING ARTS
Design and Applied Arts.
Arts & Humanities
VISUAL AND PERFORMING ARTS
Drama/Theatre Arts and Stagecraft.
Arts & Humanities
VISUAL AND PERFORMING ARTS
Film/Video and Photographic Arts.
Arts & Humanities
VISUAL AND PERFORMING ARTS
Fine and Studio Arts.
Arts & Humanities
VISUAL AND PERFORMING ARTS
Music.
Arts & Humanities
VISUAL AND PERFORMING ARTS
Arts, Entertainment, and Media Management.
Arts & Humanities
VISUAL AND PERFORMING ARTS
Visual and Performing Arts, Other.
Arts & Humanities
HISTORY
History.
Broad discipline
CIP Family Title
CIP Subfamily Title
Business
BUSINESS, MANAGEMENT, MARKETING, AND RELATED SUPPORT SERVICES
Business Administration, Management and Operations.
Business
BUSINESS, MANAGEMENT, MARKETING, AND RELATED SUPPORT SERVICES
Business/Managerial Economics.
Business
BUSINESS, MANAGEMENT, MARKETING, AND RELATED SUPPORT SERVICES
Human Resources Management and Services.
Business
BUSINESS, MANAGEMENT, MARKETING, AND RELATED SUPPORT SERVICES
Management Information Systems and Services.
Business
BUSINESS, MANAGEMENT, MARKETING, AND RELATED SUPPORT SERVICES
Management Sciences and Quantitative Methods.
Computer Science
COMPUTER AND INFORMATION SCIENCES AND SUPPORT SERVICES
Computer and Information Sciences, General.
Computer Science
COMPUTER AND INFORMATION SCIENCES AND SUPPORT SERVICES
Computer Programming.
Computer Science
COMPUTER AND INFORMATION SCIENCES AND SUPPORT SERVICES
Information Science/Studies.
Computer Science
COMPUTER AND INFORMATION SCIENCES AND SUPPORT SERVICES
Computer Science.
Computer Science
COMPUTER AND INFORMATION SCIENCES AND SUPPORT SERVICES
Computer Software and Media Applications.
Computer Science
COMPUTER AND INFORMATION SCIENCES AND SUPPORT SERVICES
Computer/Information Technology Administration and Management.
Education
EDUCATION
Education, General.
Education
EDUCATION
Social and Philosophical Foundations of Education.
Education
EDUCATION
Special Education and Teaching.
Education
EDUCATION
Teacher Education and Professional Development, Specific Subject Areas.
Engineering
ENGINEERING
Engineering, General.
Engineering
ENGINEERING
Aerospace, Aeronautical, and Astronautical/Space Engineering.
Engineering
ENGINEERING
Agricultural Engineering.
Engineering
ENGINEERING
Biomedical/Medical Engineering.
Engineering
ENGINEERING
Chemical Engineering.
Engineering
ENGINEERING
Civil Engineering.
Engineering
ENGINEERING
Computer Engineering.
Engineering
ENGINEERING
Electrical, Electronics, and Communications Engineering.
Engineering
ENGINEERING
Engineering Physics.
Engineering
ENGINEERING
Engineering Science.
Engineering
ENGINEERING
Environmental/Environmental Health Engineering.
Engineering
ENGINEERING
Materials Engineering.
Engineering
ENGINEERING
Mechanical Engineering.
Engineering
ENGINEERING
Nuclear Engineering.
Engineering
ENGINEERING
Operations Research.
Engineering
ENGINEERING
Geological/Geophysical Engineering.
Engineering
ENGINEERING
Mechatronics, Robotics, and Automation Engineering.
Engineering
ENGINEERING
Biochemical Engineering.
Engineering
ENGINEERING
Biological/Biosystems Engineering.
Engineering
ENGINEERING
Engineering, Other.
Life Sciences
AGRICULTURAL/ ANIMAL/ PLANT/ VETERINARY SCIENCE AND RELATED FIELDS
Animal Sciences.
Life Sciences
AGRICULTURAL/ ANIMAL/ PLANT/ VETERINARY SCIENCE AND RELATED FIELDS
Food Science and Technology.
Life Sciences
AGRICULTURAL/ ANIMAL/ PLANT/ VETERINARY SCIENCE AND RELATED FIELDS
Plant Sciences.
Life Sciences
NATURAL RESOURCES AND CONSERVATION
Natural Resources Conservation and Research.
Life Sciences
NATURAL RESOURCES AND CONSERVATION
Forestry.
Life Sciences
NATURAL RESOURCES AND CONSERVATION
Wildlife and Wildlands Science and Management.
Life Sciences
NATURAL RESOURCES AND CONSERVATION
Natural Resources and Conservation, Other.
Life Sciences
BIOLOGICAL AND BIOMEDICAL SCIENCES
Biology, General.
Life Sciences
BIOLOGICAL AND BIOMEDICAL SCIENCES
Biochemistry, Biophysics and Molecular Biology.
Life Sciences
BIOLOGICAL AND BIOMEDICAL SCIENCES
Botany/Plant Biology.
Life Sciences
BIOLOGICAL AND BIOMEDICAL SCIENCES
Cell/Cellular Biology and Anatomical Sciences.
Life Sciences
BIOLOGICAL AND BIOMEDICAL SCIENCES
Microbiological Sciences and Immunology.
Life Sciences
BIOLOGICAL AND BIOMEDICAL SCIENCES
Zoology/Animal Biology.
Life Sciences
BIOLOGICAL AND BIOMEDICAL SCIENCES
Genetics.
Life Sciences
BIOLOGICAL AND BIOMEDICAL SCIENCES
Physiology, Pathology and Related Sciences.
Life Sciences
BIOLOGICAL AND BIOMEDICAL SCIENCES
Pharmacology and Toxicology.
Life Sciences
BIOLOGICAL AND BIOMEDICAL SCIENCES
Biomathematics, Bioinformatics, and Computational Biology.
Life Sciences
BIOLOGICAL AND BIOMEDICAL SCIENCES
Biotechnology.
Life Sciences
BIOLOGICAL AND BIOMEDICAL SCIENCES
Ecology, Evolution, Systematics, and Population Biology.
Life Sciences
BIOLOGICAL AND BIOMEDICAL SCIENCES
Neurobiology and Neurosciences.
Life Sciences
BIOLOGICAL AND BIOMEDICAL SCIENCES
Biological and Biomedical Sciences, Other.
Broad discipline
CIP Family Title
CIP Subfamily Title
Nursing
HEALTH PROFESSIONS AND RELATED PROGRAMS
Registered Nursing, Nursing Administration, Nursing Research and Clinical
Other Health Science
HEALTH PROFESSIONS AND RELATED PROGRAMS
Pharmacy, Pharmaceutical Sciences, and Administration.
Other Health Science
HEALTH PROFESSIONS AND RELATED PROGRAMS
Public Health.
Other/ Interdisciplinary
AGRICULTURAL/ ANIMAL/ PLANT/ VETERINARY SCIENCE AND RELATED FIELDS
Agricultural Business and Management.
Other/ Interdisciplinary
AGRICULTURAL/ ANIMAL/ PLANT/ VETERINARY SCIENCE AND RELATED FIELDS
Agricultural Production Operations.
Other/ Interdisciplinary
AGRICULTURAL/ ANIMAL/ PLANT/ VETERINARY SCIENCE AND RELATED FIELDS
International Agriculture.
Other/ Interdisciplinary
COMMUNICATION, JOURNALISM, AND RELATED PROGRAMS
Communication and Media Studies.
Other/ Interdisciplinary
COMMUNICATION, JOURNALISM, AND RELATED PROGRAMS
Journalism.
Other/ Interdisciplinary
LEGAL PROFESSIONS AND STUDIES
Non-Professional Legal Studies.
Other/ Interdisciplinary
MULTI/INTERDISCIPLINARY STUDIES
Peace Studies and Conflict Resolution.
Other/ Interdisciplinary
MULTI/INTERDISCIPLINARY STUDIES
Mathematics and Computer Science.
Other/ Interdisciplinary
MULTI/INTERDISCIPLINARY STUDIES
Medieval and Renaissance Studies.
Other/ Interdisciplinary
MULTI/INTERDISCIPLINARY STUDIES
Science, Technology and Society.
Other/ Interdisciplinary
MULTI/INTERDISCIPLINARY STUDIES
Nutrition Sciences.
Other/ Interdisciplinary
MULTI/INTERDISCIPLINARY STUDIES
International/Globalization Studies.
Other/ Interdisciplinary
MULTI/INTERDISCIPLINARY STUDIES
Classical and Ancient Studies.
Other/ Interdisciplinary
MULTI/INTERDISCIPLINARY STUDIES
Cognitive Science.
Other/ Interdisciplinary
MULTI/INTERDISCIPLINARY STUDIES
Human Biology.
Other/ Interdisciplinary
MULTI/INTERDISCIPLINARY STUDIES
Marine Sciences.
Other/ Interdisciplinary
MULTI/INTERDISCIPLINARY STUDIES
Sustainability Studies.
Other/ Interdisciplinary
MULTI/INTERDISCIPLINARY STUDIES
Geography and Environmental Studies.
Other/ Interdisciplinary
MULTI/INTERDISCIPLINARY STUDIES
Data Science.
Other/ Interdisciplinary
MULTI/INTERDISCIPLINARY STUDIES
Multi/Interdisciplinary Studies, Other.
Pharmacy
HEALTH PROFESSIONS AND RELATED PROGRAMS
Pharmacy, Pharmaceutical Sciences, and Administration.
Physical Sciences/Math
MATHEMATICS AND STATISTICS
Mathematics.
Physical Sciences/Math
MATHEMATICS AND STATISTICS
Applied Mathematics.
Physical Sciences/Math
MATHEMATICS AND STATISTICS
Statistics.
Physical Sciences/Math
PHYSICAL SCIENCES
Astronomy and Astrophysics.
Physical Sciences/Math
PHYSICAL SCIENCES
Atmospheric Sciences and Meteorology.
Physical Sciences/Math
PHYSICAL SCIENCES
Chemistry.
Physical Sciences/Math
PHYSICAL SCIENCES
Geological and Earth Sciences/Geosciences.
Physical Sciences/Math
PHYSICAL SCIENCES
Physics.
Physical Sciences/Math
PHYSICAL SCIENCES
Materials Sciences.
Physical Sciences/Math
PHYSICAL SCIENCES
Physical Sciences, Other.
Broad discipline
CIP Family Title
CIP Subfamily Title
Public Admin
PUBLIC ADMINISTRATION AND SOCIAL SERVICE PROFESSIONS
Community Organization and Advocacy.
Public Admin
PUBLIC ADMINISTRATION AND SOCIAL SERVICE PROFESSIONS
Public Administration.
Public Admin
PUBLIC ADMINISTRATION AND SOCIAL SERVICE PROFESSIONS
Public Policy Analysis.
Public Admin
PUBLIC ADMINISTRATION AND SOCIAL SERVICE PROFESSIONS
Social Work.
Public Admin
PUBLIC ADMINISTRATION AND SOCIAL SERVICE PROFESSIONS
Public Administration and Social Service Professions, Other.
Public Health
HEALTH PROFESSIONS AND RELATED PROGRAMS
Public Health.
Social Sciences
AGRICULTURAL/ANIMAL/ PLANT/VETERINARY SCIENCE AND RELATED FIELDS
Agricultural Business and Management.
Social Sciences
AREA, ETHNIC, CULTURAL, GENDER, AND GROUP STUDIES
Area Studies.
Social Sciences
AREA, ETHNIC, CULTURAL, GENDER, AND GROUP STUDIES
Ethnic, Cultural Minority, Gender, and Group Studies.
Social Sciences
AREA, ETHNIC, CULTURAL, GENDER, AND GROUP STUDIES
Area, Ethnic, Cultural, Gender, and Group Studies, Other.
Social Sciences
FAMILY AND CONSUMER SCIENCES/HUMAN SCIENCES
Human Development, Family Studies, and Related Services.
Social Sciences
FAMILY AND CONSUMER SCIENCES/HUMAN SCIENCES
Apparel and Textiles.
Social Sciences
PSYCHOLOGY
Psychology, General.
Social Sciences
PSYCHOLOGY
Research and Experimental Psychology.
Social Sciences
PSYCHOLOGY
Clinical, Counseling and Applied Psychology.
Social Sciences
PSYCHOLOGY
Psychology, Other.
Social Sciences
SOCIAL SCIENCES
Social Sciences, General.
Social Sciences
SOCIAL SCIENCES
Anthropology.
Social Sciences
SOCIAL SCIENCES
Archeology.
Social Sciences
SOCIAL SCIENCES
Criminology.
Social Sciences
SOCIAL SCIENCES
Economics.
Social Sciences
SOCIAL SCIENCES
Geography and Cartography.
Social Sciences
SOCIAL SCIENCES
International Relations and National Security Studies.
Social Sciences
SOCIAL SCIENCES
Political Science and Government.
Social Sciences
SOCIAL SCIENCES
Sociology.
Social Sciences
SOCIAL SCIENCES
Urban Studies/Affairs.
Social Sciences
SOCIAL SCIENCES
Social Sciences, Other.

California Electricity Generation

What are the main sources of California’s electricity?
I added the option to view the graph for any day or monthly average from April 2018 to the present using the calendar picker and a daily generation summary
In the United States, electric power plant emissions account for about 25% of greenhouse gas emissions. However, California has been a leader in the transition to clean and renewable energy, driven by ambitious climate policies and a commitment to reducing greenhouse gas emissions. The state has set an electricity target for the state of 60% renewables by 2030 and 100% zero-carbon, clean electricity by 2045. To meet these targets, the state has been investing heavily into solar and wind energy sources. Solar is the largest proportion of California’s electricity grid and California now generates more solar energy than any other state.
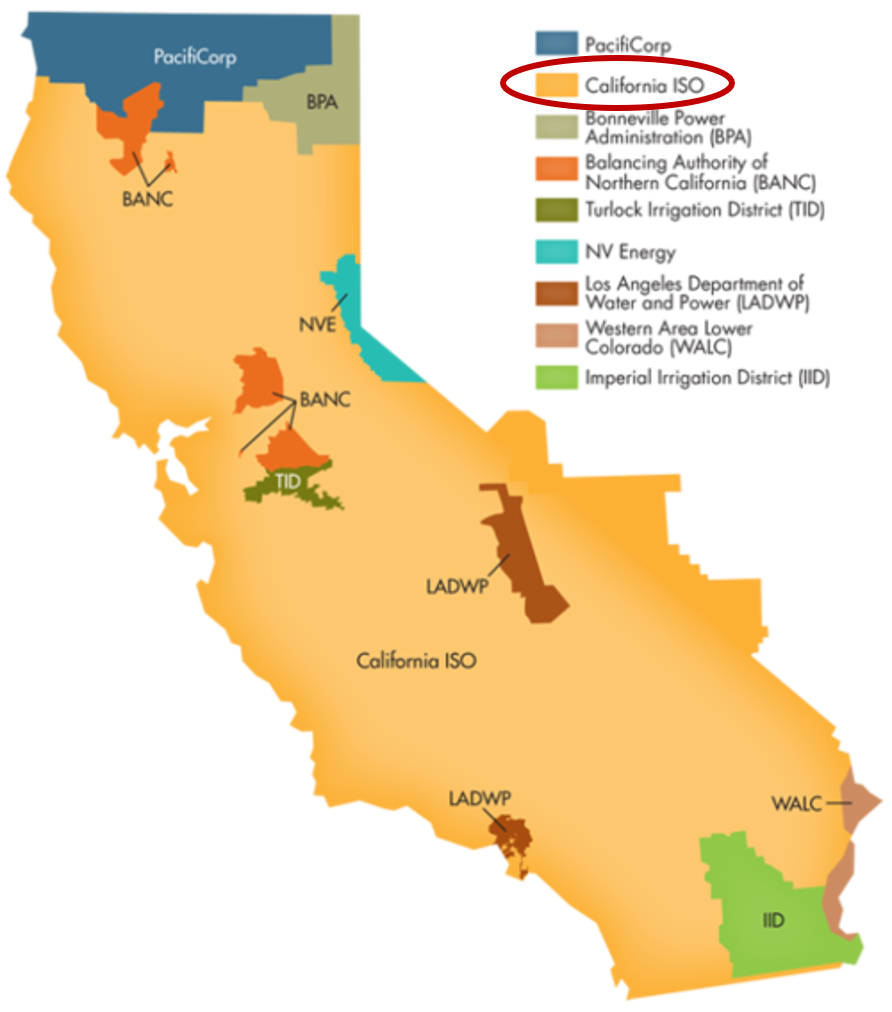
The California Independent System Operator manages the grid for around 32 million Californians or about 80% of the total demand in the state. Here is a map showing the service area and the other electricity districts in the state, the main exceptions include the city of LA and the Sacramento area.
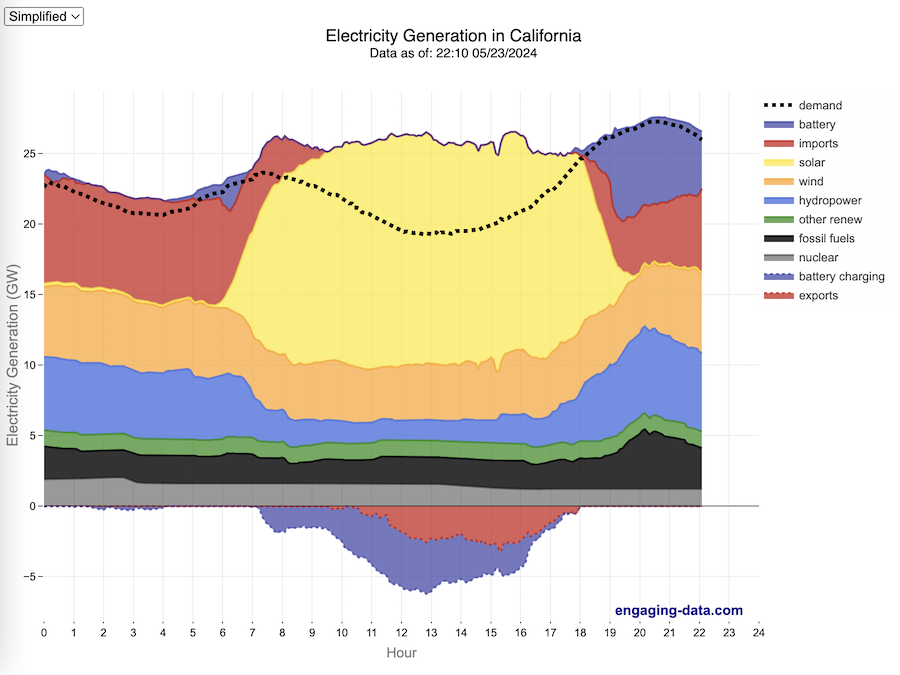
How to read the graph of California’s electricity
The graphs shown here allow us to visualize how electricity generation in the California Independent System Operator (CAISO) region varies over the course of the day. We can see how solar ramps up to be a huge contributor in the middle of the day. And overall, the vast majority of the generation in the state is one form of renewable electricity or another (e.g. solar, wind, hydro, geothermal, biomass and biogas). Add in a small contribution from zero-carbon nuclear energy and we can see that a large majority of power generation comes from zero-carbon sources. It also shows the total electricity demand, which should always be less than the total electricity supply in the state.
Because of the intermittent nature of some renewables, like wind and solar, there are times where the demand for electricity is not able to be met by these sources, and other options are needed to maintain supply demand balance on the state’s grid. To address this issue, the state relies on importing power from outside of the state as well as energy storage (primarily batteries) to meet electricity demand when renewable energy supply is low. If demand is much less than supply, then likely there will be power exported or some charging of batteries. And if demand is less than total generation in the state, power will be imported and/or batteries will be discharged to make up for the power shortfall.
On the graph, positive values from batteries and imports is when those sources are supplying power to the California grid. Negative values for batteries and exports are when there is excess power in the state and batteries are being charged up or power is being exported to neighboring states.
You can view the graph in two forms:
- Detailed – shows all of the power plant fuel types that is provided in the CAISO data: Solar, Wind, Nuclear, Coal, Other, Natural Gas, Large Hydropower, Small Hydropower, Geothermal, Biomass and Biogas. In addition, it shows aggregated net imports into the state from other regions as well as battery discharging or charging.
- Simplified – I aggregated the categories from CAISO into Solar, Wind, Nuclear, Fossil Fuel (including Coal, Other and Natural Gas), Hydro (Large and Small Hydropower), and Other Renewable (Geothermal, Biomass and Biogas). In addition, it shows aggregated net imports into the state from other regions as well as battery discharging or charging.
Also, I added the ability to see yesterday’s data as well. In the future, I will add the ability to see other dates as well.
Data Sources and Tools
Data for electricity sources for California grid comes from the California Independent System Operator (CAISO). This data from this site is downloaded and processed using a python script and updated every 5 minutes. The graph is made using the open source Plotly javascript graphing library.
Tioga Pass (Yosemite) Opening Dates
When does Tioga Pass in Yosemite typically open?
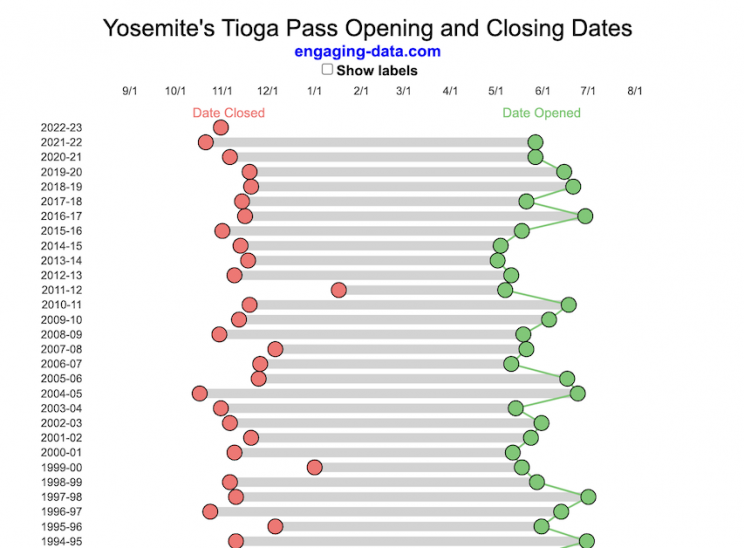
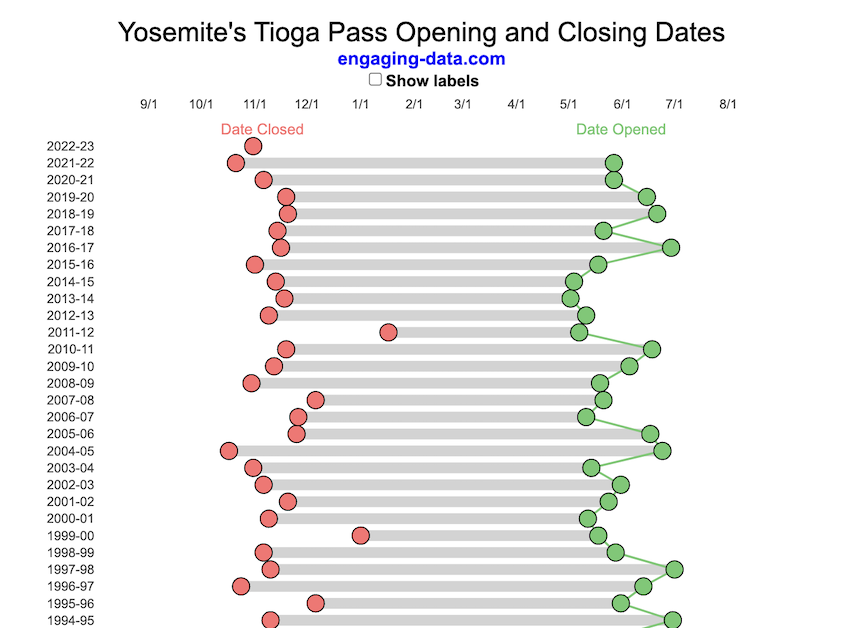
The graph shows the closing and opening dates of Tioga pass in Yosemite National Park for each winter season from 1933 to the present. Tioga pass is a mountain pass on State Highway 120 in California’s Sierra Nevada mountain range and one of the entrances to Yosemite NP. The pass itself peaks at 9945 ft above sea level. Each winter it gets a ton of snow, but also with a great deal of variability, which really affects when it can be plowed and the road reopened.
Our family likes to go to Yosemite in June after the kids school lets out and sometimes Hwy 120 and Tioga Pass can often be closed at this time, which limits which areas of the park you can visit. So I often look at data on when the road has opened before and thought it would be a good thing to visualize.
You can toggle the labels on the graph that show the dates of opening and closing as well as the number of days that the pass was closed each winter. Hovering (or clicking) on the circles on the graph will give you a pop up which gives you the exact date.
Data and Tools
The data comes from the US National Park Service for most recent data as well as Mono Basin Clearinghouse for earlier data going back to 1933. Data was organized and compiled in MS Excel. Visualization was done in javascript and specifically the plotly visualization library.
Colorado River Reservoir Levels
How much water is in the main Colorado River reservoirs?
Check out my California Reservoir Levels Dashboard
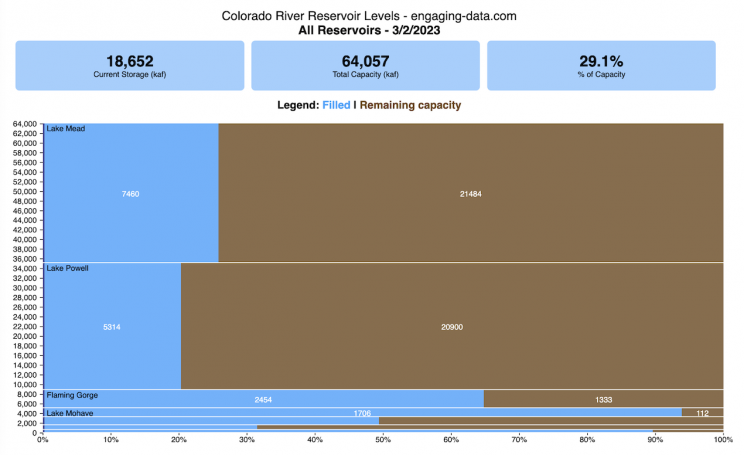
I based this graph off of my California Reservoir marimekko graph, because many folks were interested in seeing a similar figure for the Colorado river reservoirs.
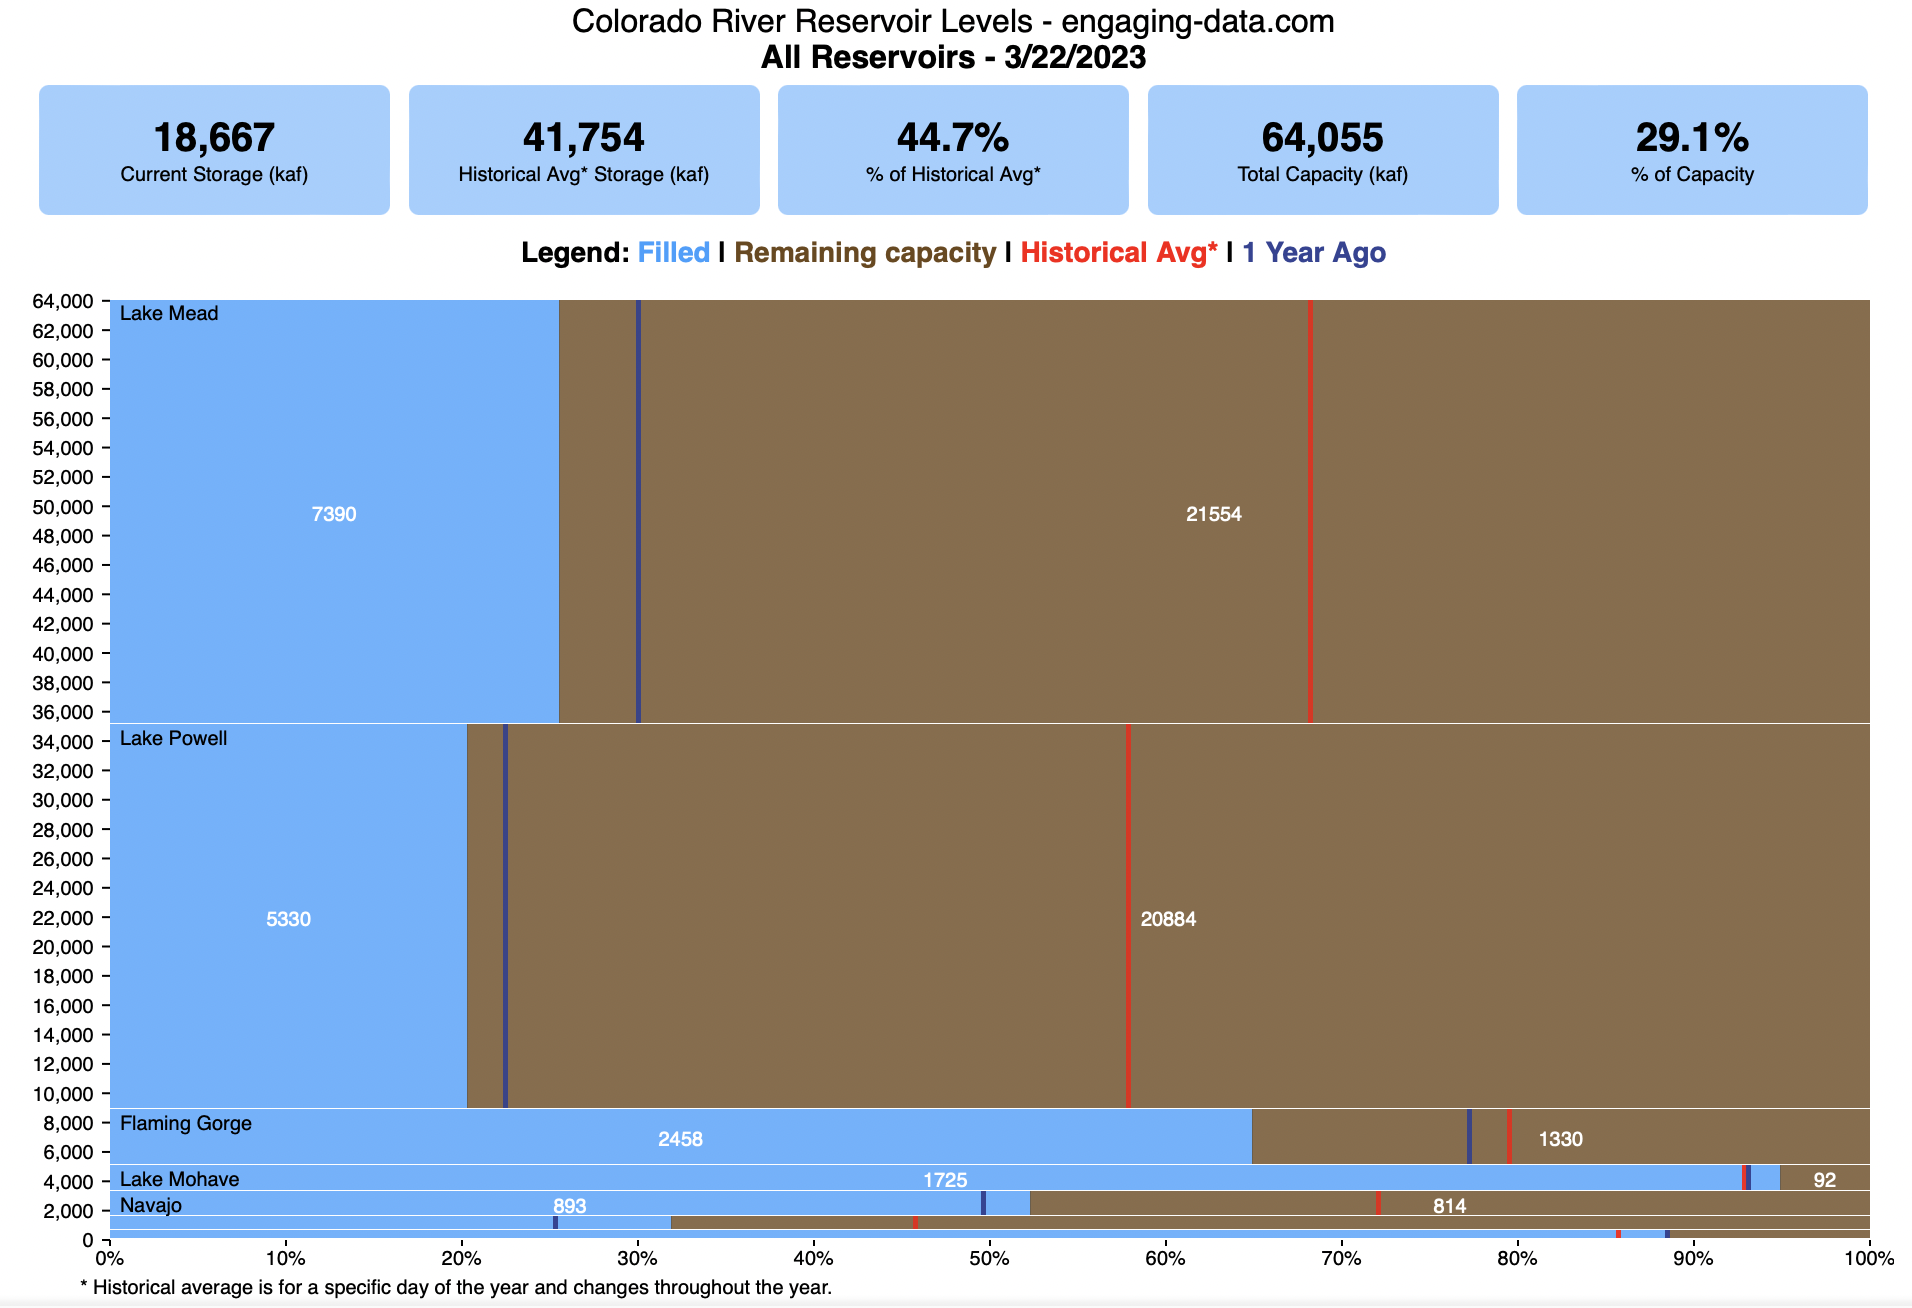
This is a marimekko (or mekko) graph which may take some time to understand if you aren’t used to seeing them. Each “row” represents one reservoir, with bars showing how much of the reservoir is filled (blue) and unfilled (brown). The height of the “row” indicates how much water the reservoir could hold. Lake Mead is the reservoir with the largest capacity (at almost 29,000 kaf) and so it is the tallest row. The proportion of blue to brown will show how full it is. As with the California version of this graph, there are also lines that represent historical levels, including historical median level for the day of the year (in red) and the 1 year ago level, which is shown as a dark blue line. I also added the “Deadpool” level for the two largest reservoirs. This is the level at which water cannot flow past the dam and is stuck in the reservoir.
Lake Mead and Lake Powell are by far the largest of these reservoirs and also included are several smaller reservoirs (relative to these two) so the bars will be very thin to the point where they are barely a sliver or may not even show up.
Historical Data
Historical data comes from https://www.water-data.com/ and differs for each reservoir.
- Lake Mead – 1941 to 2015
- Lake Powell – 1964 to 2015
- Flaming Gorge – 1972 to 2015
- Lake Mohave – 1952 to 2015
- Lake Navajo – 1969 to 2015
- Blue Mesa – 1969 to 2015
- Lake Havasu – 1939 to 2015
The daily data for each reservoir was captured in this time period and median value for each day of the calendar year was calculated and this is shown as the red line on the graph.
Instructions:
If you are on a computer, you can hover your cursor over a reservoir and the dashboard at the top will provide information about that individual reservoir. If you are on a mobile device you can tap the reservoir to get that same info. It’s not possible to see or really interact with the tiniest slivers. The main goal of this visualization is to provide a quick overview of the status of the main reservoirs along the Colorado River (or that provide water to the Colorado).
Units are in kaf, thousands of acre feet. 1 kaf is the amount of water that would cover 1 acre in one thousand feet of water (or 1000 acres in water in 1 foot of water). It is also the amount of water in a cube that is 352 feet per side (about the length of a football field). Lake Mead is very large and could hold about 35 cubic kilometers of water at full (but not flood) capacity.
Data and Tools
The data on water storage comes from the US Bureau of Reclamation’s Lower Colorado River Water Operations website. Historical reservoir levels comes from the water-data.com website. Python is used to extract the data and wrangle the data in to a clean format, using the Pandas data analysis library. Visualization was done in javascript and specifically the D3.js visualization library.
Visualizing California’s Water Storage – Reservoirs and Snowpack
How much water is stored in California’s snowpack and reservoirs?
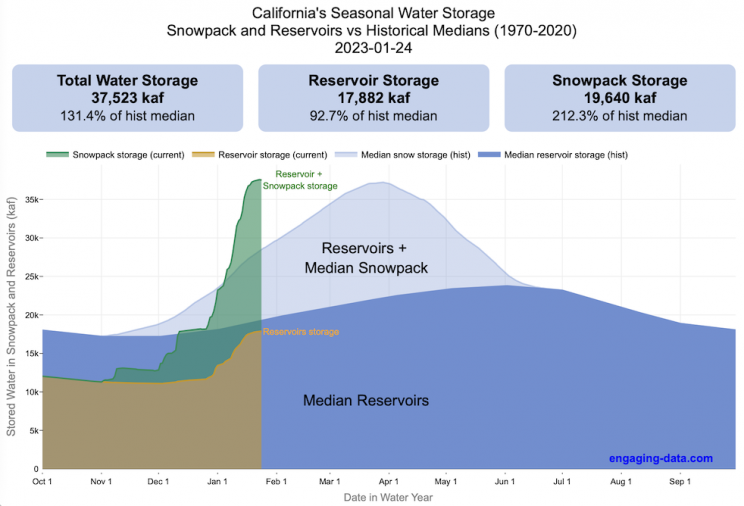
California’s snow pack is essentially another “reservoir” that is able to store water in the Sierra Nevada mountains. Graphing these things together can give a better picture of the state of California’s water and drought.
The historical median (i.e. 50th percentile) for snow pack water content is stacked on top of the median for reservoirs storage (shown in two shades of blue). The current water year reservoirs is shown in orange and the current year’s snow pack measurement is stacked on top in green. What is interesting is that the typical peak snow pack (around April 1) holds almost as much water (about 2/3 as much) as the reservoirs typically do. However, the reservoirs can store these volumes for much of the year while the snow pack is very seasonal and only does so for a short period of time.
Snowpack is measured at 125 different snow sensor sites throughout the Sierra Nevada mountains. The reservoir value is the total of 50 of the largest reservoirs in California. In both cases, the median is derived from calculating the median values for each day of the year from historical data from these locations from 1970 to 2021.
I’ve been slowly building out the water tracking visualizations tools/dashboards on this site. And with the recent rains (January 2023), there has been quite a bit of interest in these visualizations. One data visualization that I’ve wanted to create is to combine the precipitation and reservoir data into one overarching figure.
Creating the graph
I recently saw one such figure on Twitter by Mike Dettinger, a researcher who studies water/climate issues. The graph shows the current reservoir and snowpack water content overlaid on the historic levels. It is a great graph that conveys quite a bit of info and I thought I would create an interactive version of these while utilizing the automated data processing that’d I’d already created to make my other graphs/dashboards.
Time for another reservoirs-plus-snowpack storage update….LOT of snow up there now and the big Sierra reservoirs (even Shasta!) are already benefitting. Still mostly below average but moving up. Snow stacking up in UCRB. @CW3E_Scripps @DroughtGov https://t.co/2eZgNArahy pic.twitter.com/YEH4IYKlnH
— Mike Dettinger (@mdettinger) January 15, 2023
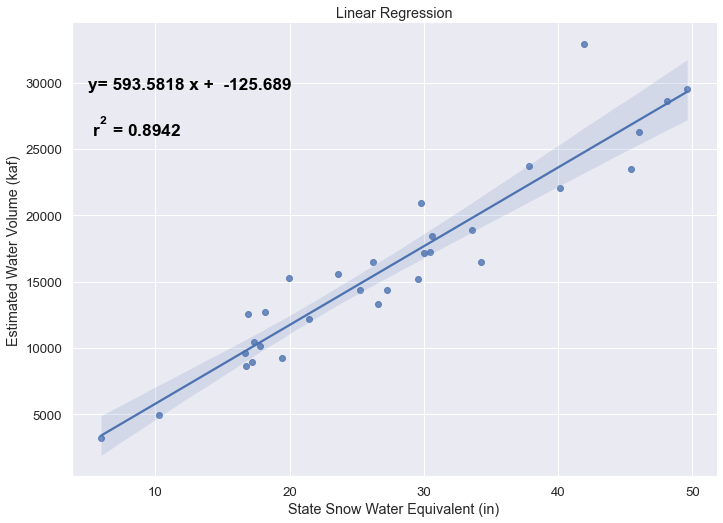
The challenge was to convert inches of snow water equivalent into a total volume of water in the snowpack, which I asked Mike about. He pointed me to a paper by Margulis et al 2016 that estimates the total volume of water in the Sierra snowpack for 31 years. Since I already had downloaded data on historical snow water equivalents for these same years, I could correlate the estimated peak snow water volume (in cubic km) to the inches of water at these 120 or so Sierra snow sensor sites. I ran a linear regression on these 30 data points. This allowed me to estimate a scaling factor that converts the inches of water equivalent to a volume of liquid water (and convert to thousands of acre feet, which is the same unit as reservoirs are measured in).
This scaling factor allows me to then graph the snowpack water volume with the reservoir volumes.
See my snowpack visualization/post to see more about snow water equivalents.
My numbers may differ slightly from the numbers reported on the state’s website. The historical percentiles that I calculated are from 1970 until 2020 while I notice the state’s average is between 1990 and 2020.
You can hover (or click) on the graph to audit the data a little more clearly.
Sources and Tools
Data is downloaded from the California Data Exchange Center website of the California Department of Water Resources using a python script. The data is processed in javascript and visualized here using HTML, CSS and javascript and the open source Plotly javascript graphing library.

California is World’s 4th Largest Economy
This is one of an ongoing series of visualizations about the state of California. This one is about the state’s economy, which recently moved into 4th place (2024), if California were its own country. It is, however, still part of the United States.
The visualization shows the relative sizes of the top 10 world economies (including the US, with California removed for context). California has the smallest population of any of the top 10, with #9 Canada just barely larger than California in population, though with a significantly smaller sized economy (about 1/2 the size).
Hover over the countries to see their GDP and population. California is behind the United States, China and Germany in total economic output (in nominal terms), but ahead of much larger countries Japan and India and the United Kingdom.
The state’s economy produces $4.1 Trillion dollars of economic output, driven by a range of industries including technology, real estate, manufacturing, agriculture and health care. It is a hub for innovation and entrepreneurship. California is also the leading agricultural state in the United States. Immigration is a huge part of the state’s workforce.
Sources and Tools:
2024 economic data was downloaded from the International Monetary Fund (IMF). This visualization is made using d3.js, an open-source javascript visualization library.
University of California Admission Rates by Major
Which majors are most competitive across the University of California system?
The University of California consists of nine campuses with undergraduate programs and they are all ranked among the best universities in the US (according to US News). All nine rank within the top 45 public schools including #1 and #2 and top 85 national universities in the US.
This data visualization focuses on the acceptance rates for students based on their indicated preferred majors in their application to the various University of California campuses in the Fall of 2023 admissions cycle. When you apply to a given university campus, you need to specify a major and this choice can affect the student’s chances of getting accepted, especially if the major is very sought after. Subjects like computer science are very popular and as a result, the data shows that most campuses have a lower acceptance rate for computer science as compared to the university as a whole.
Data visualization
The graph shown in the data visualization is a marimekko graph which shows a percentage based bar graph showing the acceptance rate (in blue) for a given major at a given university. The height of each horizontal bar is proportional to the number of applicants to that major, so taller bars have more applicants vs bars that are shorter. If you hover over (or click on mobile) a bar, it provides more information about the acceptance rate, enrollment rate (i.e. yield rate) and the GPA of accepted students. You can choose to sort the graph by subject name, admit rate or number of applicants.
The data visualization can help you explore different campuses and major categories. If you are viewing “School View“, you can see how the various disciplines compare for a single university at one time. Whereas if you view “Subject View” you can see the comparison of a single discipline across the University campuses that offer those majors.
The University of California has over 240,000 undergraduate students and extends about 140,000 acceptances to fill out 42,000 slots for first year students. There is a significant amount of overlap as most students applying for admission apply to several campuses, and many students get accepted to multiple campuses.
The broad disciplines used in the visualization are composed of a number of individual majors and these are detailed in the table below.
GPA calculation
The University of California only considers grades from 10th grade and 11th grade for admissions decisions, and uses a weighted system where honors and AP classes are given an extra point in GPA calculations above the normal A=4, B=3, C=2, etc. . GPA calculation. So for an honors math class, for example, an A would be worth 5 points.
Sources and Tools:
Data comes directly from the University of California website for the fall of 2023, which has quite a bit of interesting data about students and admissions. I downloaded the data and processed it with python to organize it. The webtool is made using javascript, HTML and CSS and graphed using the open-source plotly graphing library.
Table of Disciplines to majors
This table lists the specific areas and majors that make up the broad disciplines shown in the data visualization.
| Broad discipline | CIP Family Title | CIP Subfamily Title |
|---|---|---|
| Architecture | ARCHITECTURE AND RELATED SERVICES | Architecture. |
| Architecture | ARCHITECTURE AND RELATED SERVICES | City/Urban, Community, and Regional Planning. |
| Architecture | ARCHITECTURE AND RELATED SERVICES | Environmental Design. |
| Architecture | ARCHITECTURE AND RELATED SERVICES | Landscape Architecture. |
| Architecture | ARCHITECTURE AND RELATED SERVICES | Real Estate Development. |
| Arts & Humanities | FOREIGN LANGUAGES, LITERATURES, AND LINGUISTICS | Linguistic, Comparative, and Related Language Studies and Services. |
| Arts & Humanities | FOREIGN LANGUAGES, LITERATURES, AND LINGUISTICS | African Languages, Literatures, and Linguistics. |
| Arts & Humanities | FOREIGN LANGUAGES, LITERATURES, AND LINGUISTICS | East Asian Languages, Literatures, and Linguistics. |
| Arts & Humanities | FOREIGN LANGUAGES, LITERATURES, AND LINGUISTICS | Slavic, Baltic and Albanian Languages, Literatures, and Linguistics. |
| Arts & Humanities | FOREIGN LANGUAGES, LITERATURES, AND LINGUISTICS | Germanic Languages, Literatures, and Linguistics. |
| Arts & Humanities | FOREIGN LANGUAGES, LITERATURES, AND LINGUISTICS | Romance Languages, Literatures, and Linguistics. |
| Arts & Humanities | FOREIGN LANGUAGES, LITERATURES, AND LINGUISTICS | Middle/Near Eastern and Semitic Languages, Literatures, and Linguistics. |
| Arts & Humanities | FOREIGN LANGUAGES, LITERATURES, AND LINGUISTICS | Classics and Classical Languages, Literatures, and Linguistics. |
| Arts & Humanities | FOREIGN LANGUAGES, LITERATURES, AND LINGUISTICS | Celtic Languages, Literatures, and Linguistics. |
| Arts & Humanities | FOREIGN LANGUAGES, LITERATURES, AND LINGUISTICS | Foreign Languages, Literatures, and Linguistics, Other. |
| Arts & Humanities | ENGLISH LANGUAGE AND LITERATURE/LETTERS | English Language and Literature, General. |
| Arts & Humanities | ENGLISH LANGUAGE AND LITERATURE/LETTERS | Rhetoric and Composition/Writing Studies. |
| Arts & Humanities | ENGLISH LANGUAGE AND LITERATURE/LETTERS | Literature. |
| Arts & Humanities | ENGLISH LANGUAGE AND LITERATURE/LETTERS | English Language and Literature/Letters, Other. |
| Arts & Humanities | LIBERAL ARTS AND SCIENCES, GENERAL STUDIES AND HUMANITIES | Liberal Arts and Sciences, General Studies and Humanities. |
| Arts & Humanities | PHILOSOPHY AND RELIGIOUS STUDIES | Philosophy. |
| Arts & Humanities | PHILOSOPHY AND RELIGIOUS STUDIES | Religion/Religious Studies. |
| Arts & Humanities | VISUAL AND PERFORMING ARTS | Visual and Performing Arts, General. |
| Arts & Humanities | VISUAL AND PERFORMING ARTS | Dance. |
| Arts & Humanities | VISUAL AND PERFORMING ARTS | Design and Applied Arts. |
| Arts & Humanities | VISUAL AND PERFORMING ARTS | Drama/Theatre Arts and Stagecraft. |
| Arts & Humanities | VISUAL AND PERFORMING ARTS | Film/Video and Photographic Arts. |
| Arts & Humanities | VISUAL AND PERFORMING ARTS | Fine and Studio Arts. |
| Arts & Humanities | VISUAL AND PERFORMING ARTS | Music. |
| Arts & Humanities | VISUAL AND PERFORMING ARTS | Arts, Entertainment, and Media Management. |
| Arts & Humanities | VISUAL AND PERFORMING ARTS | Visual and Performing Arts, Other. |
| Arts & Humanities | HISTORY | History. |
| Broad discipline | CIP Family Title | CIP Subfamily Title |
|---|---|---|
| Business | BUSINESS, MANAGEMENT, MARKETING, AND RELATED SUPPORT SERVICES | Business Administration, Management and Operations. |
| Business | BUSINESS, MANAGEMENT, MARKETING, AND RELATED SUPPORT SERVICES | Business/Managerial Economics. |
| Business | BUSINESS, MANAGEMENT, MARKETING, AND RELATED SUPPORT SERVICES | Human Resources Management and Services. |
| Business | BUSINESS, MANAGEMENT, MARKETING, AND RELATED SUPPORT SERVICES | Management Information Systems and Services. |
| Business | BUSINESS, MANAGEMENT, MARKETING, AND RELATED SUPPORT SERVICES | Management Sciences and Quantitative Methods. |
| Computer Science | COMPUTER AND INFORMATION SCIENCES AND SUPPORT SERVICES | Computer and Information Sciences, General. |
| Computer Science | COMPUTER AND INFORMATION SCIENCES AND SUPPORT SERVICES | Computer Programming. |
| Computer Science | COMPUTER AND INFORMATION SCIENCES AND SUPPORT SERVICES | Information Science/Studies. |
| Computer Science | COMPUTER AND INFORMATION SCIENCES AND SUPPORT SERVICES | Computer Science. |
| Computer Science | COMPUTER AND INFORMATION SCIENCES AND SUPPORT SERVICES | Computer Software and Media Applications. |
| Computer Science | COMPUTER AND INFORMATION SCIENCES AND SUPPORT SERVICES | Computer/Information Technology Administration and Management. |
| Education | EDUCATION | Education, General. |
| Education | EDUCATION | Social and Philosophical Foundations of Education. |
| Education | EDUCATION | Special Education and Teaching. |
| Education | EDUCATION | Teacher Education and Professional Development, Specific Subject Areas. |
| Engineering | ENGINEERING | Engineering, General. |
| Engineering | ENGINEERING | Aerospace, Aeronautical, and Astronautical/Space Engineering. |
| Engineering | ENGINEERING | Agricultural Engineering. |
| Engineering | ENGINEERING | Biomedical/Medical Engineering. |
| Engineering | ENGINEERING | Chemical Engineering. |
| Engineering | ENGINEERING | Civil Engineering. |
| Engineering | ENGINEERING | Computer Engineering. |
| Engineering | ENGINEERING | Electrical, Electronics, and Communications Engineering. |
| Engineering | ENGINEERING | Engineering Physics. |
| Engineering | ENGINEERING | Engineering Science. |
| Engineering | ENGINEERING | Environmental/Environmental Health Engineering. |
| Engineering | ENGINEERING | Materials Engineering. |
| Engineering | ENGINEERING | Mechanical Engineering. |
| Engineering | ENGINEERING | Nuclear Engineering. |
| Engineering | ENGINEERING | Operations Research. |
| Engineering | ENGINEERING | Geological/Geophysical Engineering. |
| Engineering | ENGINEERING | Mechatronics, Robotics, and Automation Engineering. |
| Engineering | ENGINEERING | Biochemical Engineering. |
| Engineering | ENGINEERING | Biological/Biosystems Engineering. |
| Engineering | ENGINEERING | Engineering, Other. |
| Life Sciences | AGRICULTURAL/ ANIMAL/ PLANT/ VETERINARY SCIENCE AND RELATED FIELDS | Animal Sciences. |
| Life Sciences | AGRICULTURAL/ ANIMAL/ PLANT/ VETERINARY SCIENCE AND RELATED FIELDS | Food Science and Technology. |
| Life Sciences | AGRICULTURAL/ ANIMAL/ PLANT/ VETERINARY SCIENCE AND RELATED FIELDS | Plant Sciences. |
| Life Sciences | NATURAL RESOURCES AND CONSERVATION | Natural Resources Conservation and Research. |
| Life Sciences | NATURAL RESOURCES AND CONSERVATION | Forestry. |
| Life Sciences | NATURAL RESOURCES AND CONSERVATION | Wildlife and Wildlands Science and Management. |
| Life Sciences | NATURAL RESOURCES AND CONSERVATION | Natural Resources and Conservation, Other. |
| Life Sciences | BIOLOGICAL AND BIOMEDICAL SCIENCES | Biology, General. |
| Life Sciences | BIOLOGICAL AND BIOMEDICAL SCIENCES | Biochemistry, Biophysics and Molecular Biology. |
| Life Sciences | BIOLOGICAL AND BIOMEDICAL SCIENCES | Botany/Plant Biology. |
| Life Sciences | BIOLOGICAL AND BIOMEDICAL SCIENCES | Cell/Cellular Biology and Anatomical Sciences. |
| Life Sciences | BIOLOGICAL AND BIOMEDICAL SCIENCES | Microbiological Sciences and Immunology. |
| Life Sciences | BIOLOGICAL AND BIOMEDICAL SCIENCES | Zoology/Animal Biology. |
| Life Sciences | BIOLOGICAL AND BIOMEDICAL SCIENCES | Genetics. |
| Life Sciences | BIOLOGICAL AND BIOMEDICAL SCIENCES | Physiology, Pathology and Related Sciences. |
| Life Sciences | BIOLOGICAL AND BIOMEDICAL SCIENCES | Pharmacology and Toxicology. |
| Life Sciences | BIOLOGICAL AND BIOMEDICAL SCIENCES | Biomathematics, Bioinformatics, and Computational Biology. |
| Life Sciences | BIOLOGICAL AND BIOMEDICAL SCIENCES | Biotechnology. |
| Life Sciences | BIOLOGICAL AND BIOMEDICAL SCIENCES | Ecology, Evolution, Systematics, and Population Biology. |
| Life Sciences | BIOLOGICAL AND BIOMEDICAL SCIENCES | Neurobiology and Neurosciences. |
| Life Sciences | BIOLOGICAL AND BIOMEDICAL SCIENCES | Biological and Biomedical Sciences, Other. |
| Broad discipline | CIP Family Title | CIP Subfamily Title |
|---|---|---|
| Nursing | HEALTH PROFESSIONS AND RELATED PROGRAMS | Registered Nursing, Nursing Administration, Nursing Research and Clinical |
| Other Health Science | HEALTH PROFESSIONS AND RELATED PROGRAMS | Pharmacy, Pharmaceutical Sciences, and Administration. |
| Other Health Science | HEALTH PROFESSIONS AND RELATED PROGRAMS | Public Health. |
| Other/ Interdisciplinary | AGRICULTURAL/ ANIMAL/ PLANT/ VETERINARY SCIENCE AND RELATED FIELDS | Agricultural Business and Management. |
| Other/ Interdisciplinary | AGRICULTURAL/ ANIMAL/ PLANT/ VETERINARY SCIENCE AND RELATED FIELDS | Agricultural Production Operations. |
| Other/ Interdisciplinary | AGRICULTURAL/ ANIMAL/ PLANT/ VETERINARY SCIENCE AND RELATED FIELDS | International Agriculture. |
| Other/ Interdisciplinary | COMMUNICATION, JOURNALISM, AND RELATED PROGRAMS | Communication and Media Studies. |
| Other/ Interdisciplinary | COMMUNICATION, JOURNALISM, AND RELATED PROGRAMS | Journalism. |
| Other/ Interdisciplinary | LEGAL PROFESSIONS AND STUDIES | Non-Professional Legal Studies. |
| Other/ Interdisciplinary | MULTI/INTERDISCIPLINARY STUDIES | Peace Studies and Conflict Resolution. |
| Other/ Interdisciplinary | MULTI/INTERDISCIPLINARY STUDIES | Mathematics and Computer Science. |
| Other/ Interdisciplinary | MULTI/INTERDISCIPLINARY STUDIES | Medieval and Renaissance Studies. |
| Other/ Interdisciplinary | MULTI/INTERDISCIPLINARY STUDIES | Science, Technology and Society. |
| Other/ Interdisciplinary | MULTI/INTERDISCIPLINARY STUDIES | Nutrition Sciences. |
| Other/ Interdisciplinary | MULTI/INTERDISCIPLINARY STUDIES | International/Globalization Studies. |
| Other/ Interdisciplinary | MULTI/INTERDISCIPLINARY STUDIES | Classical and Ancient Studies. |
| Other/ Interdisciplinary | MULTI/INTERDISCIPLINARY STUDIES | Cognitive Science. |
| Other/ Interdisciplinary | MULTI/INTERDISCIPLINARY STUDIES | Human Biology. |
| Other/ Interdisciplinary | MULTI/INTERDISCIPLINARY STUDIES | Marine Sciences. |
| Other/ Interdisciplinary | MULTI/INTERDISCIPLINARY STUDIES | Sustainability Studies. |
| Other/ Interdisciplinary | MULTI/INTERDISCIPLINARY STUDIES | Geography and Environmental Studies. |
| Other/ Interdisciplinary | MULTI/INTERDISCIPLINARY STUDIES | Data Science. |
| Other/ Interdisciplinary | MULTI/INTERDISCIPLINARY STUDIES | Multi/Interdisciplinary Studies, Other. |
| Pharmacy | HEALTH PROFESSIONS AND RELATED PROGRAMS | Pharmacy, Pharmaceutical Sciences, and Administration. |
| Physical Sciences/Math | MATHEMATICS AND STATISTICS | Mathematics. |
| Physical Sciences/Math | MATHEMATICS AND STATISTICS | Applied Mathematics. |
| Physical Sciences/Math | MATHEMATICS AND STATISTICS | Statistics. |
| Physical Sciences/Math | PHYSICAL SCIENCES | Astronomy and Astrophysics. |
| Physical Sciences/Math | PHYSICAL SCIENCES | Atmospheric Sciences and Meteorology. |
| Physical Sciences/Math | PHYSICAL SCIENCES | Chemistry. |
| Physical Sciences/Math | PHYSICAL SCIENCES | Geological and Earth Sciences/Geosciences. |
| Physical Sciences/Math | PHYSICAL SCIENCES | Physics. |
| Physical Sciences/Math | PHYSICAL SCIENCES | Materials Sciences. |
| Physical Sciences/Math | PHYSICAL SCIENCES | Physical Sciences, Other. |
| Broad discipline | CIP Family Title | CIP Subfamily Title |
|---|---|---|
| Public Admin | PUBLIC ADMINISTRATION AND SOCIAL SERVICE PROFESSIONS | Community Organization and Advocacy. |
| Public Admin | PUBLIC ADMINISTRATION AND SOCIAL SERVICE PROFESSIONS | Public Administration. |
| Public Admin | PUBLIC ADMINISTRATION AND SOCIAL SERVICE PROFESSIONS | Public Policy Analysis. |
| Public Admin | PUBLIC ADMINISTRATION AND SOCIAL SERVICE PROFESSIONS | Social Work. |
| Public Admin | PUBLIC ADMINISTRATION AND SOCIAL SERVICE PROFESSIONS | Public Administration and Social Service Professions, Other. |
| Public Health | HEALTH PROFESSIONS AND RELATED PROGRAMS | Public Health. |
| Social Sciences | AGRICULTURAL/ANIMAL/ PLANT/VETERINARY SCIENCE AND RELATED FIELDS | Agricultural Business and Management. |
| Social Sciences | AREA, ETHNIC, CULTURAL, GENDER, AND GROUP STUDIES | Area Studies. |
| Social Sciences | AREA, ETHNIC, CULTURAL, GENDER, AND GROUP STUDIES | Ethnic, Cultural Minority, Gender, and Group Studies. |
| Social Sciences | AREA, ETHNIC, CULTURAL, GENDER, AND GROUP STUDIES | Area, Ethnic, Cultural, Gender, and Group Studies, Other. |
| Social Sciences | FAMILY AND CONSUMER SCIENCES/HUMAN SCIENCES | Human Development, Family Studies, and Related Services. |
| Social Sciences | FAMILY AND CONSUMER SCIENCES/HUMAN SCIENCES | Apparel and Textiles. |
| Social Sciences | PSYCHOLOGY | Psychology, General. |
| Social Sciences | PSYCHOLOGY | Research and Experimental Psychology. |
| Social Sciences | PSYCHOLOGY | Clinical, Counseling and Applied Psychology. |
| Social Sciences | PSYCHOLOGY | Psychology, Other. |
| Social Sciences | SOCIAL SCIENCES | Social Sciences, General. |
| Social Sciences | SOCIAL SCIENCES | Anthropology. |
| Social Sciences | SOCIAL SCIENCES | Archeology. |
| Social Sciences | SOCIAL SCIENCES | Criminology. |
| Social Sciences | SOCIAL SCIENCES | Economics. |
| Social Sciences | SOCIAL SCIENCES | Geography and Cartography. |
| Social Sciences | SOCIAL SCIENCES | International Relations and National Security Studies. |
| Social Sciences | SOCIAL SCIENCES | Political Science and Government. |
| Social Sciences | SOCIAL SCIENCES | Sociology. |
| Social Sciences | SOCIAL SCIENCES | Urban Studies/Affairs. |
| Social Sciences | SOCIAL SCIENCES | Social Sciences, Other. |
California Electricity Generation
What are the main sources of California’s electricity?
I added the option to view the graph for any day or monthly average from April 2018 to the present using the calendar picker and a daily generation summary
In the United States, electric power plant emissions account for about 25% of greenhouse gas emissions. However, California has been a leader in the transition to clean and renewable energy, driven by ambitious climate policies and a commitment to reducing greenhouse gas emissions. The state has set an electricity target for the state of 60% renewables by 2030 and 100% zero-carbon, clean electricity by 2045. To meet these targets, the state has been investing heavily into solar and wind energy sources. Solar is the largest proportion of California’s electricity grid and California now generates more solar energy than any other state.
The California Independent System Operator manages the grid for around 32 million Californians or about 80% of the total demand in the state. Here is a map showing the service area and the other electricity districts in the state, the main exceptions include the city of LA and the Sacramento area.
How to read the graph of California’s electricity
The graphs shown here allow us to visualize how electricity generation in the California Independent System Operator (CAISO) region varies over the course of the day. We can see how solar ramps up to be a huge contributor in the middle of the day. And overall, the vast majority of the generation in the state is one form of renewable electricity or another (e.g. solar, wind, hydro, geothermal, biomass and biogas). Add in a small contribution from zero-carbon nuclear energy and we can see that a large majority of power generation comes from zero-carbon sources. It also shows the total electricity demand, which should always be less than the total electricity supply in the state.
Because of the intermittent nature of some renewables, like wind and solar, there are times where the demand for electricity is not able to be met by these sources, and other options are needed to maintain supply demand balance on the state’s grid. To address this issue, the state relies on importing power from outside of the state as well as energy storage (primarily batteries) to meet electricity demand when renewable energy supply is low. If demand is much less than supply, then likely there will be power exported or some charging of batteries. And if demand is less than total generation in the state, power will be imported and/or batteries will be discharged to make up for the power shortfall.
On the graph, positive values from batteries and imports is when those sources are supplying power to the California grid. Negative values for batteries and exports are when there is excess power in the state and batteries are being charged up or power is being exported to neighboring states.
You can view the graph in two forms:
- Detailed – shows all of the power plant fuel types that is provided in the CAISO data: Solar, Wind, Nuclear, Coal, Other, Natural Gas, Large Hydropower, Small Hydropower, Geothermal, Biomass and Biogas. In addition, it shows aggregated net imports into the state from other regions as well as battery discharging or charging.
- Simplified – I aggregated the categories from CAISO into Solar, Wind, Nuclear, Fossil Fuel (including Coal, Other and Natural Gas), Hydro (Large and Small Hydropower), and Other Renewable (Geothermal, Biomass and Biogas). In addition, it shows aggregated net imports into the state from other regions as well as battery discharging or charging.
Also, I added the ability to see yesterday’s data as well. In the future, I will add the ability to see other dates as well.
Data Sources and Tools
Data for electricity sources for California grid comes from the California Independent System Operator (CAISO). This data from this site is downloaded and processed using a python script and updated every 5 minutes. The graph is made using the open source Plotly javascript graphing library.
Tioga Pass (Yosemite) Opening Dates
When does Tioga Pass in Yosemite typically open?
The graph shows the closing and opening dates of Tioga pass in Yosemite National Park for each winter season from 1933 to the present. Tioga pass is a mountain pass on State Highway 120 in California’s Sierra Nevada mountain range and one of the entrances to Yosemite NP. The pass itself peaks at 9945 ft above sea level. Each winter it gets a ton of snow, but also with a great deal of variability, which really affects when it can be plowed and the road reopened.
Our family likes to go to Yosemite in June after the kids school lets out and sometimes Hwy 120 and Tioga Pass can often be closed at this time, which limits which areas of the park you can visit. So I often look at data on when the road has opened before and thought it would be a good thing to visualize.
You can toggle the labels on the graph that show the dates of opening and closing as well as the number of days that the pass was closed each winter. Hovering (or clicking) on the circles on the graph will give you a pop up which gives you the exact date.
Data and Tools
The data comes from the US National Park Service for most recent data as well as Mono Basin Clearinghouse for earlier data going back to 1933. Data was organized and compiled in MS Excel. Visualization was done in javascript and specifically the plotly visualization library.
Colorado River Reservoir Levels
How much water is in the main Colorado River reservoirs?
Check out my California Reservoir Levels Dashboard
I based this graph off of my California Reservoir marimekko graph, because many folks were interested in seeing a similar figure for the Colorado river reservoirs.
This is a marimekko (or mekko) graph which may take some time to understand if you aren’t used to seeing them. Each “row” represents one reservoir, with bars showing how much of the reservoir is filled (blue) and unfilled (brown). The height of the “row” indicates how much water the reservoir could hold. Lake Mead is the reservoir with the largest capacity (at almost 29,000 kaf) and so it is the tallest row. The proportion of blue to brown will show how full it is. As with the California version of this graph, there are also lines that represent historical levels, including historical median level for the day of the year (in red) and the 1 year ago level, which is shown as a dark blue line. I also added the “Deadpool” level for the two largest reservoirs. This is the level at which water cannot flow past the dam and is stuck in the reservoir.
Lake Mead and Lake Powell are by far the largest of these reservoirs and also included are several smaller reservoirs (relative to these two) so the bars will be very thin to the point where they are barely a sliver or may not even show up.
Historical Data
Historical data comes from https://www.water-data.com/ and differs for each reservoir.
- Lake Mead – 1941 to 2015
- Lake Powell – 1964 to 2015
- Flaming Gorge – 1972 to 2015
- Lake Mohave – 1952 to 2015
- Lake Navajo – 1969 to 2015
- Blue Mesa – 1969 to 2015
- Lake Havasu – 1939 to 2015
The daily data for each reservoir was captured in this time period and median value for each day of the calendar year was calculated and this is shown as the red line on the graph.
Instructions:
If you are on a computer, you can hover your cursor over a reservoir and the dashboard at the top will provide information about that individual reservoir. If you are on a mobile device you can tap the reservoir to get that same info. It’s not possible to see or really interact with the tiniest slivers. The main goal of this visualization is to provide a quick overview of the status of the main reservoirs along the Colorado River (or that provide water to the Colorado).
Units are in kaf, thousands of acre feet. 1 kaf is the amount of water that would cover 1 acre in one thousand feet of water (or 1000 acres in water in 1 foot of water). It is also the amount of water in a cube that is 352 feet per side (about the length of a football field). Lake Mead is very large and could hold about 35 cubic kilometers of water at full (but not flood) capacity.
Data and Tools
The data on water storage comes from the US Bureau of Reclamation’s Lower Colorado River Water Operations website. Historical reservoir levels comes from the water-data.com website. Python is used to extract the data and wrangle the data in to a clean format, using the Pandas data analysis library. Visualization was done in javascript and specifically the D3.js visualization library.
Visualizing California’s Water Storage – Reservoirs and Snowpack
How much water is stored in California’s snowpack and reservoirs?
California’s snow pack is essentially another “reservoir” that is able to store water in the Sierra Nevada mountains. Graphing these things together can give a better picture of the state of California’s water and drought.
The historical median (i.e. 50th percentile) for snow pack water content is stacked on top of the median for reservoirs storage (shown in two shades of blue). The current water year reservoirs is shown in orange and the current year’s snow pack measurement is stacked on top in green. What is interesting is that the typical peak snow pack (around April 1) holds almost as much water (about 2/3 as much) as the reservoirs typically do. However, the reservoirs can store these volumes for much of the year while the snow pack is very seasonal and only does so for a short period of time.
Snowpack is measured at 125 different snow sensor sites throughout the Sierra Nevada mountains. The reservoir value is the total of 50 of the largest reservoirs in California. In both cases, the median is derived from calculating the median values for each day of the year from historical data from these locations from 1970 to 2021.
I’ve been slowly building out the water tracking visualizations tools/dashboards on this site. And with the recent rains (January 2023), there has been quite a bit of interest in these visualizations. One data visualization that I’ve wanted to create is to combine the precipitation and reservoir data into one overarching figure.
Creating the graph
I recently saw one such figure on Twitter by Mike Dettinger, a researcher who studies water/climate issues. The graph shows the current reservoir and snowpack water content overlaid on the historic levels. It is a great graph that conveys quite a bit of info and I thought I would create an interactive version of these while utilizing the automated data processing that’d I’d already created to make my other graphs/dashboards.
Time for another reservoirs-plus-snowpack storage update….LOT of snow up there now and the big Sierra reservoirs (even Shasta!) are already benefitting. Still mostly below average but moving up. Snow stacking up in UCRB. @CW3E_Scripps @DroughtGov https://t.co/2eZgNArahy pic.twitter.com/YEH4IYKlnH
— Mike Dettinger (@mdettinger) January 15, 2023
The challenge was to convert inches of snow water equivalent into a total volume of water in the snowpack, which I asked Mike about. He pointed me to a paper by Margulis et al 2016 that estimates the total volume of water in the Sierra snowpack for 31 years. Since I already had downloaded data on historical snow water equivalents for these same years, I could correlate the estimated peak snow water volume (in cubic km) to the inches of water at these 120 or so Sierra snow sensor sites. I ran a linear regression on these 30 data points. This allowed me to estimate a scaling factor that converts the inches of water equivalent to a volume of liquid water (and convert to thousands of acre feet, which is the same unit as reservoirs are measured in).
This scaling factor allows me to then graph the snowpack water volume with the reservoir volumes.
See my snowpack visualization/post to see more about snow water equivalents.
My numbers may differ slightly from the numbers reported on the state’s website. The historical percentiles that I calculated are from 1970 until 2020 while I notice the state’s average is between 1990 and 2020.
You can hover (or click) on the graph to audit the data a little more clearly.
Sources and Tools
Data is downloaded from the California Data Exchange Center website of the California Department of Water Resources using a python script. The data is processed in javascript and visualized here using HTML, CSS and javascript and the open source Plotly javascript graphing library.
Recent Comments