Posts for Tag: California
California Snowpack Levels Visualization
How does the current California snowpack compare with Historical Averages?
If you are looking at this it’s probably winter in California and hopefully snowy in the mountains. In the winter, snow is one of the primary ways that water is stored in California and is on the same order of magnitude as the amount of water in reservoirs.
When I made this graph of California snowpack levels (Jan 2023) we’ve had quite a bit of rain and snow so far and so I wanted to visualize how this year compares with historical levels for this time of year. This graph will provide a constantly updated way to keep tabs on the water content in the Sierra snowpack.
Snow water content is just what it sounds like. It is an estimate of the water content of the snow. Since snow can have be relatively dry or moist, and can be fluffy or compacted, measuring snow depth is not as accurate as measuring the amount of water in the snow. There are multiple ways of measuring the water content of snow, including pads under the snow that measure the weight of the overlying snow, sensors that use sound waves and weighing snow cores.
I used data for California snow water content totals from the California Department of Water Resources. Other California water-related visualizations include reservoir levels in the state as well.
There are three sets of stations (and a state average) that are tracked in the data and these plots:
- Northern Sierra/Trinity – (32 snow sensors)
- Central Sierra – (57 snow sensors)
- Southern Sierra – (36 snow sensors)
- State-wide average – (125 snow sensors)
Here is a map showing these three regions.
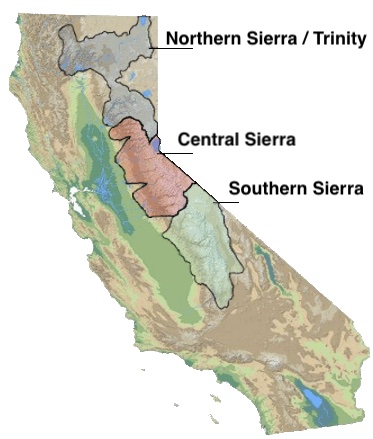
These stations are tracked because they provide important information about the state’s water supply (most of which originates from the Sierra Nevada Mountains). Winter and spring snowpack forms an important reservoir of water storage for the state as this melting snow will eventually flow into the state’s rivers and reservoirs to serve domestic and agricultural water needs.
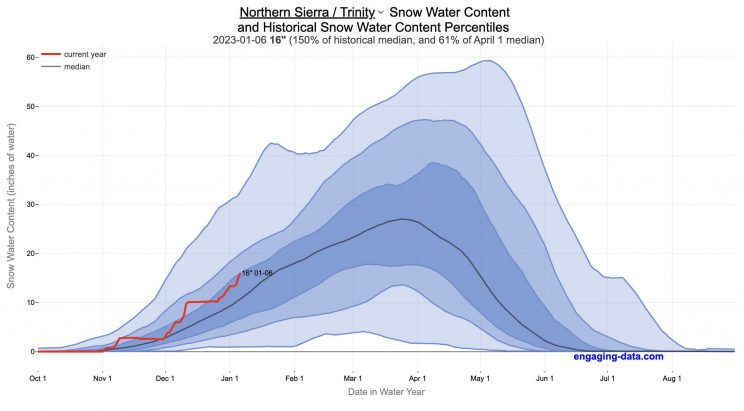
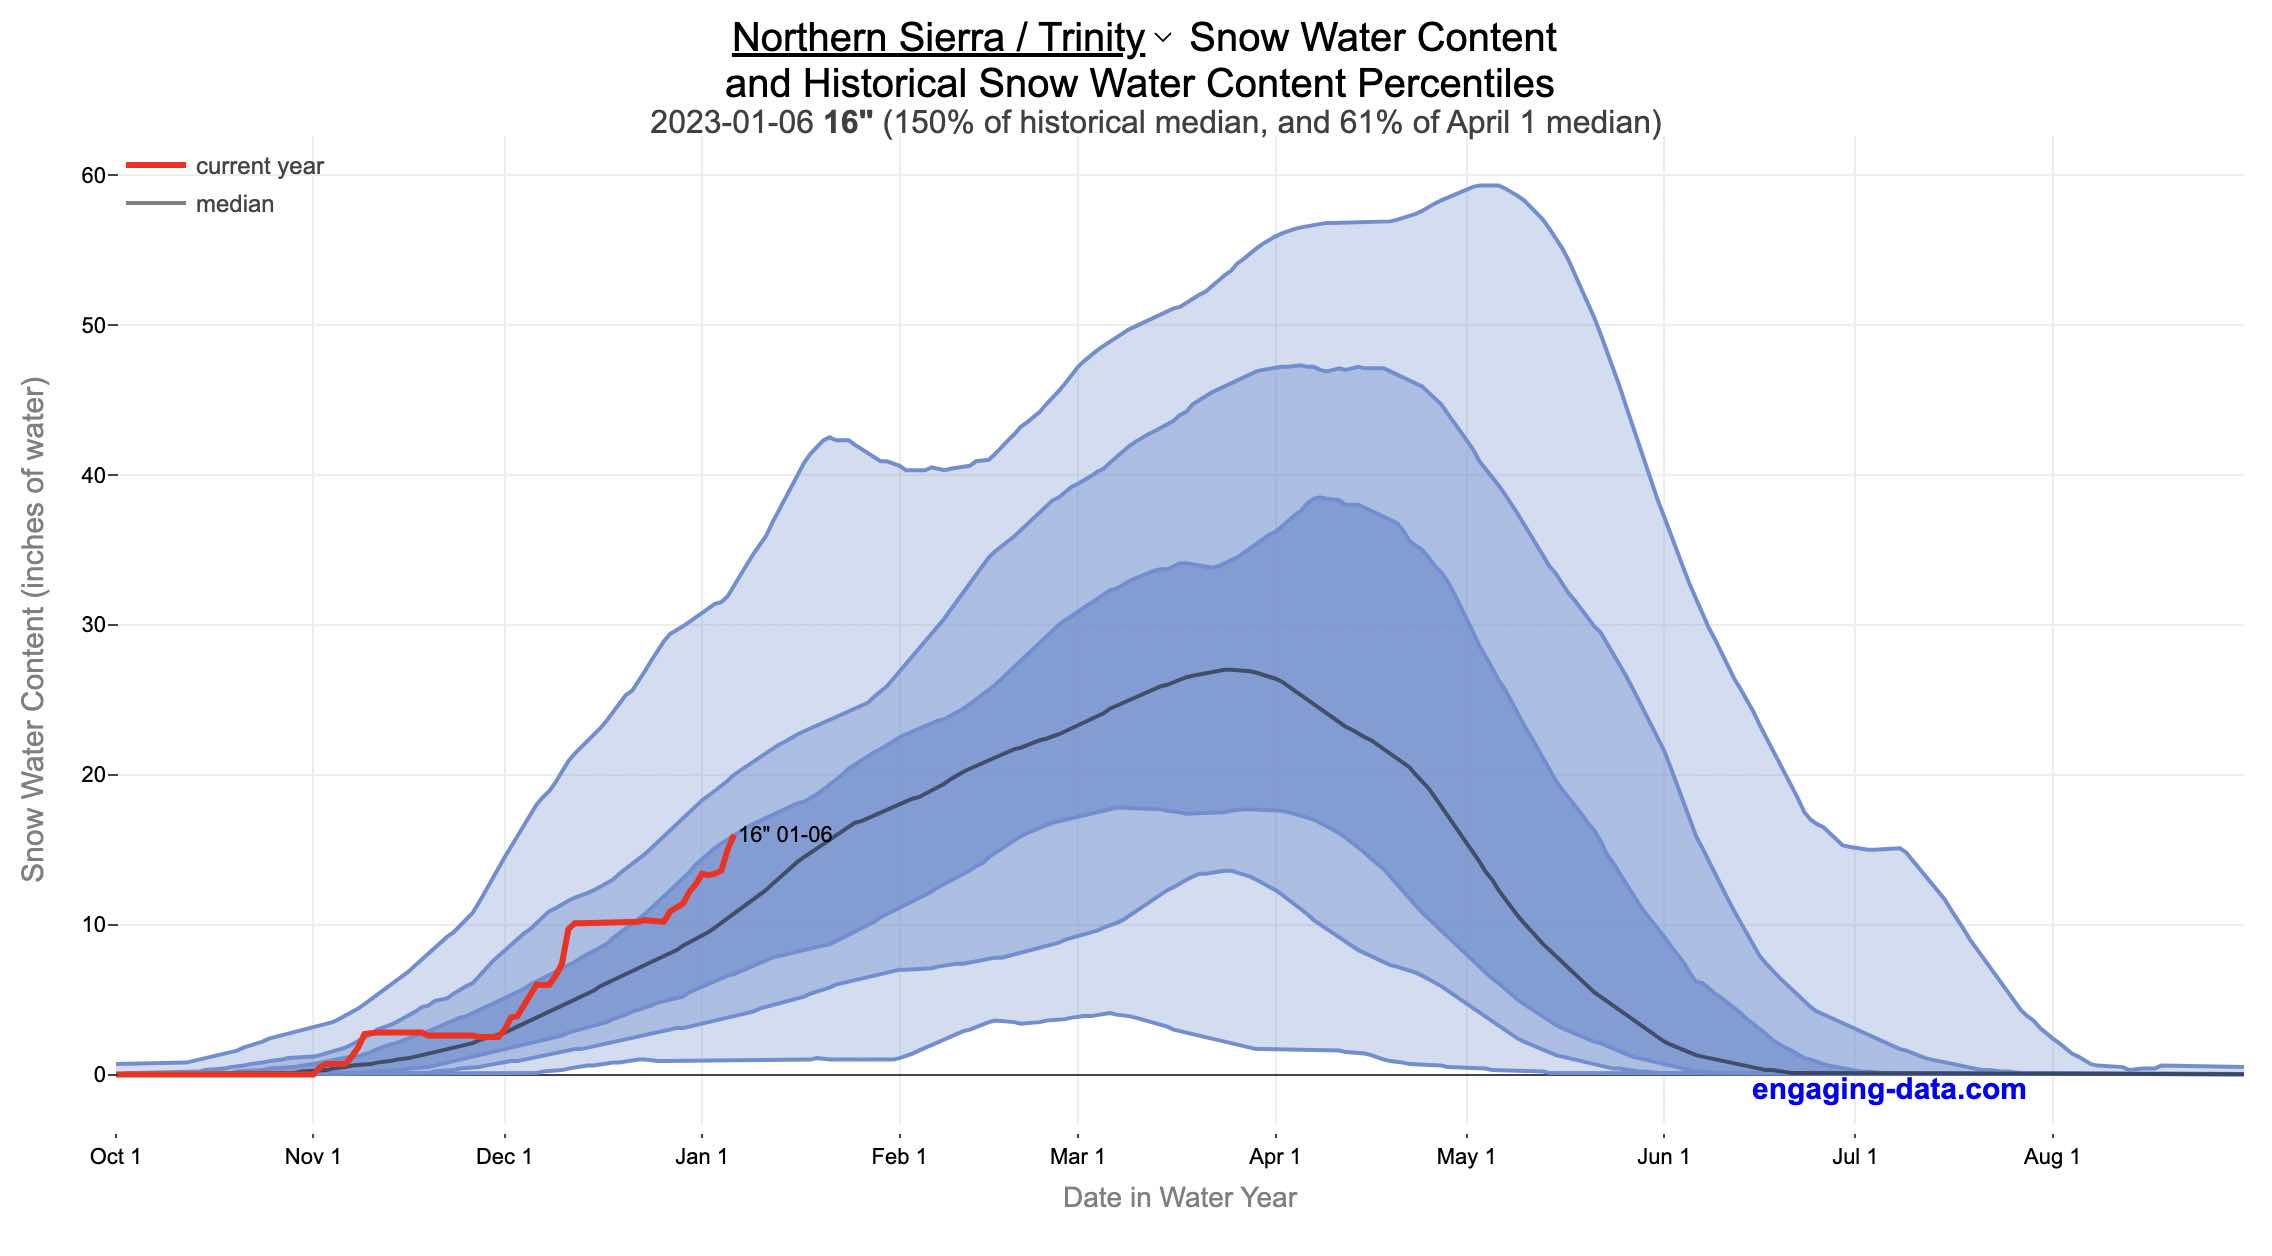
The visualization consists of a graph that shows the range of historical values for snow water content as a function of the day of the year. This range is split into percentiles of snow, spreading out like a cone from the start of the water year (October 1) ramping up to the peak in April and then converging back to zero in summertime. You can see the current water year plotted on this in red to show how it compares to historical values.
My numbers may differ slightly from the numbers reported on the state’s website. The historical percentiles that I calculated are from 1970 until 2022 while I notice the state’s average is between 1990 and 2020.
You can hover (or click) on the graph to audit the data a little more clearly.
Sources and Tools
Data is downloaded from the California Data Exchange Center website of the California Department of Water Resources using a python script. The data is processed in javascript and visualized here using HTML, CSS and javascript and the open source Plotly javascript graphing library.
California Rainfall Totals

How do current California rainfall and precipitation totals compare with Historical Averages?
If you are lookin at this visualization, it’s likely winter in California and that means the rainy season (snowy in the mountains). I wanted to visualize how the current year compares with historical levels for this time of year. I used data for California rainfall totals from the California Department of Water Resources. Other California water-related visualizations include reservoir levels in the state as well.
There are three sets of stations that are tracked in the data and these plots:
- Northern Sierra 8-station index
- Tulare Basin 6-station index
- San Joaquin 5-station index
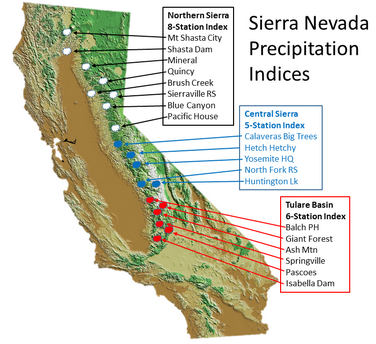
These stations are tracked because they provide important information about the state’s water supply (most of which originates from the Sierra Nevada Mountains). Data from the CDEC website appears to be updated at around 8:30am PST each day.
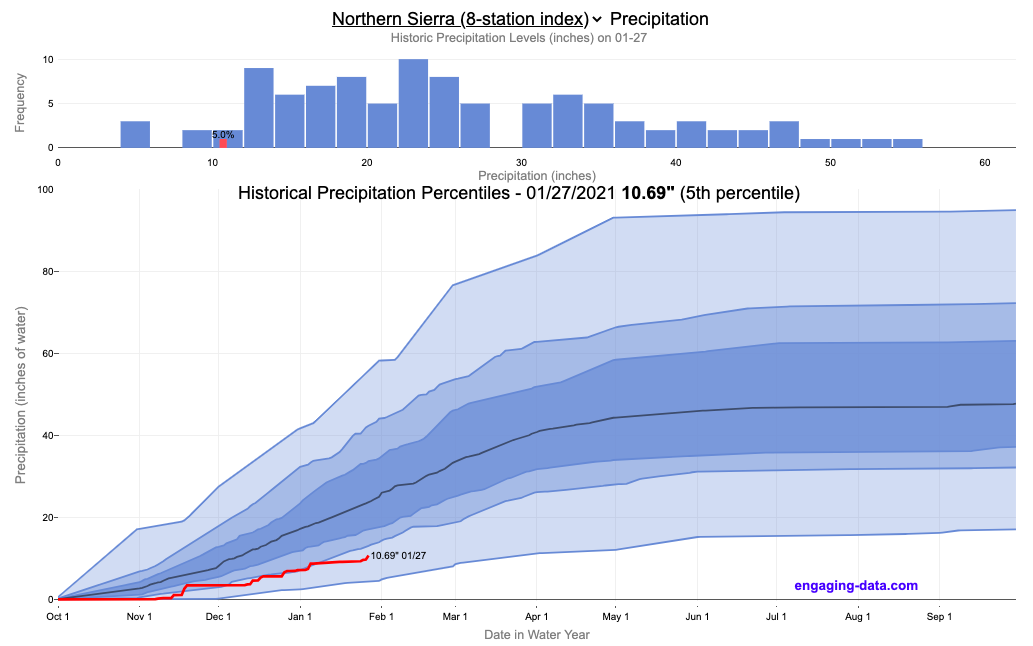
The visualization consists of two primary graphs both of which show the range of historical values for precipitation. The top graph is a histogram of water year precipitation totals on the specified date (in blue) as well as the precipitation total for the current water year in red.
The second graph shows the percentiles of precipitation over the course of the historical water year, spreading out like a cone from the start of the water year (October 1). You can see the current water year plotted on this to show how it compares to historical values. It also shows the present precipitation level and its percentile within the historical data for the day of the water year.
You can hover (or click) on the graph to audit the data a little more clearly.
Sources and Tools
Data is downloaded from the California Data Exchange Center website of the California Department of Water Resources using a python script. The data is processed in javascript and visualized here using HTML, CSS and javascript and the open source Plotly javascript graphing library.
Wildfire smoke impacts solar panel generation

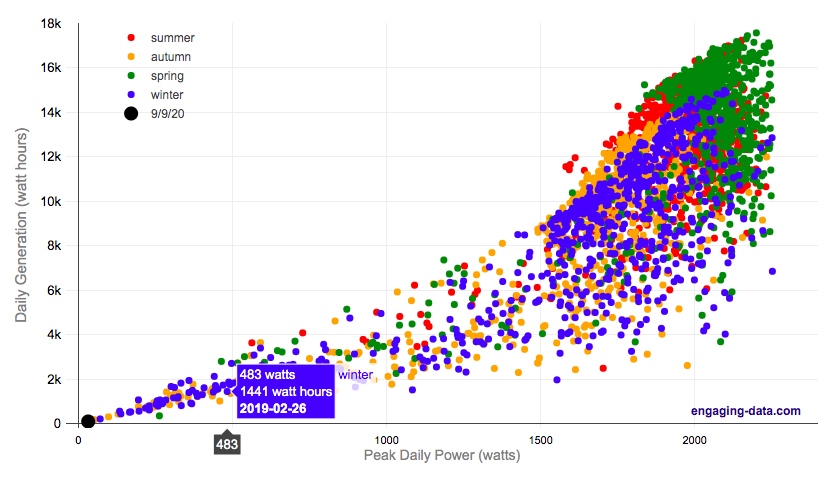
On September 9th, 2020, the entire San Francisco Bay Area, we had a crazy combination of wildfire smoke and low clouds that darkened the sky and turned everything orange. At 9am, it looked like it was nighttime and at noon, it was so dark, that it looked like dusk.
Here is a plot of 8+ years of solar panel generation from our panels. If you click on the legend, you can toggle whether that data is shown. Total generation for the day was only 93 watt hours (as opposed to a summer median of 13300 watt hours, 13.3 kWh) and peak power was only 32 watts (vs a median summer peak of 2000 watts (2.0 kW)).
The solar generation was even worse than the next worst day in winter (typically when it rains all day). Clicking on the legend will toggle whether certain seasons are shown and you can view how solar generation varies by season.
Here is a google image search of photos showing the crazy, apocalyptic scenes with the orange color.
Source and Tools:
Data on solar generation is downloaded from our solar panel inverter provider (enphase) and cleaned with a python script. Graph is made using the plotly open source javascript library.
Bay Area Coronavirus Cases
Compare the Bay Area coronavirus cases with Los Angeles and the rest of California
I wanted to better understand the coronavirus situation in my home region, the Bay Area, and I hadn’t seen any good resources that compared what was happening here to other regions in California. So I decided to make this graph. This page will be updated daily so you can come back regularly to see how the situation is changing (and hopefully improving sometime soon).
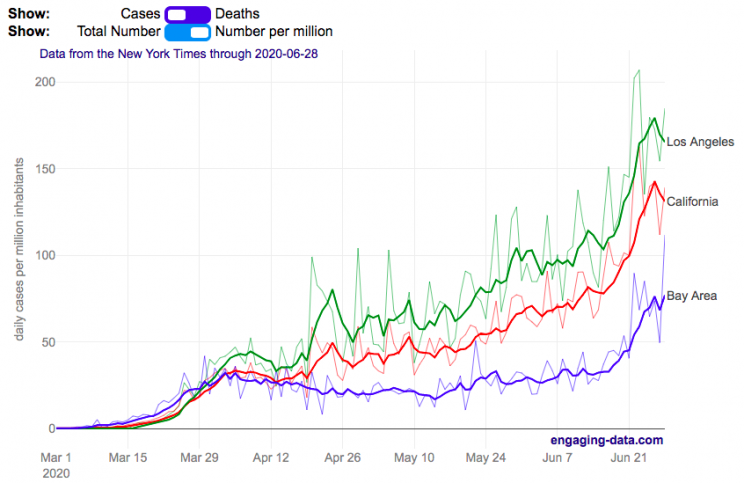
The coronavirus lockdowns began in mid-March 2020 and things have been opening up in late May, which corresponded to an uptick in coronavirus cases in the Bay Area and throughout California. While the cases in the Bay Area are increasing, it’s clear that there’s a big difference between the Bay Area and much of the rest of California. Los Angeles is currently leading the state with a large increase in the number of new cases in June as the economy tries to reopen restaurants, bars, gyms and other businesses.
You can toggle between coronavirus cases and deaths and look at the absolute numbers or on a per capita basis (per one million inhabitants). California has 39.5 million residents, while greater LA has 18.7 million residents and the Bay Area has 7.7 million residents. The daily data is shown as well as a five day moving average so you can get a better sense of the trends.
The San Francisco Bay Area was among the first regions to impose restrictions on gatherings and encourage people to stay home to fight the virus. In late February, the city of San Francisco declared an emergency in preparation for the upcoming pandemic and by early March, things became clear that life would not continue on as before.
The Bay Area is defined as the nine-county region consisting of Alameda, Contra Costa, Marin, Napa, San Francisco, San Mateo, Santa Clara, Solano and Sonoma counties.
Greater Los Angeles is defined as the 5 county region consisting of Los Angeles, Orange, Ventura, San Bernardino and Riverside counties.
Data and Tools:
County level data on coronavirus cases and deaths is from the New York Times github. Data is processed in python and javascript and graphed using the plotly open source graphing library.

Electric Vehicle Sales By State
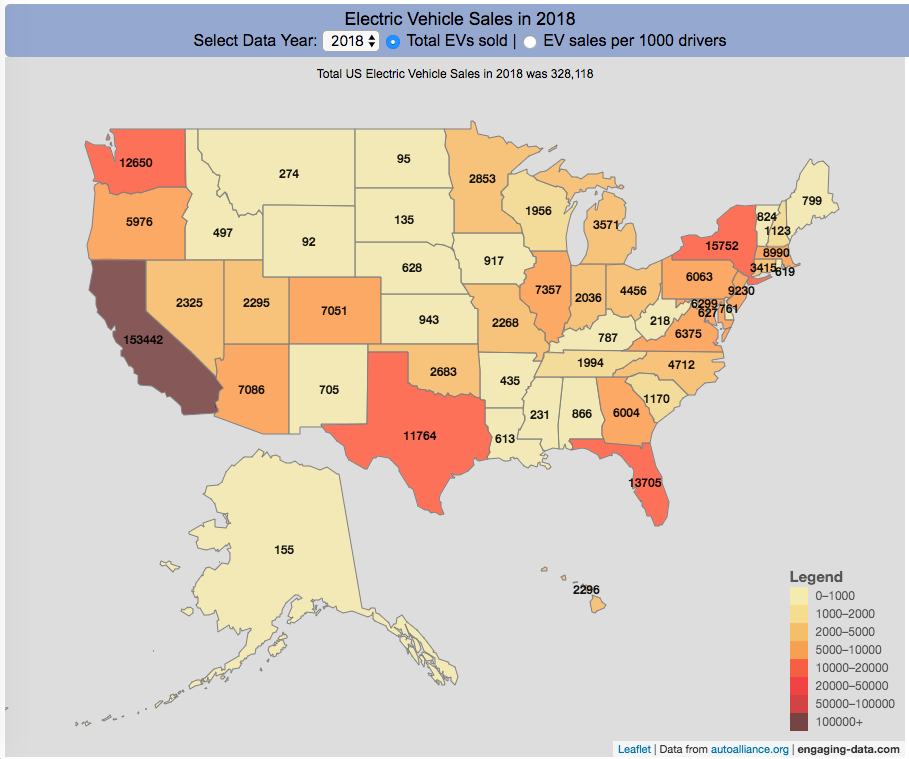
Where are electric vehicles being sold in the United States?
Electric vehicles are any vehicle that can be plugged in to recharge a battery that provides power to move the vehicle. Two broad classes are battery electric vehicles (BEVs) which only have batteries as their power source and plug-in hybrid electric vehicles (PHEVs) which have an alternative or parallel power source, typically a gasoline engine. PHEVs are built so that when the battery is depleted, the car can still run on gasoline and operate like a hybrid vehicle similar to a regular Toyota Prius (which is not plugged in at all).
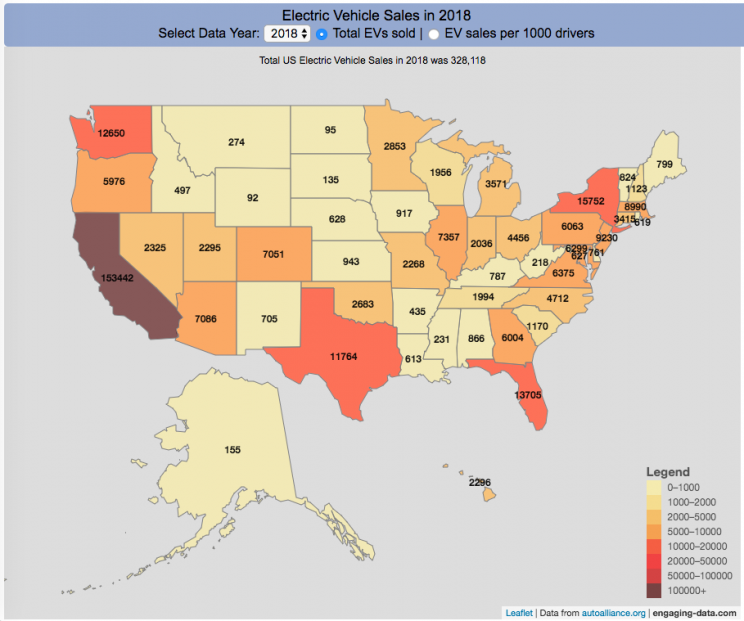
Electric vehicles (EVs) have been sold in the US since 2011 (a few commercial models were sold previous to that but not in any significant numbers) and some conversions were also available. Since then, the number of EVs sold has increased pretty significantly. I wanted to look at the distribution of where those vehicles were located. What is interesting is that California accounts for around 50% of the electric vehicles sold in the United States. Other states have lower rates of EV adoption (in some cases much, much lower). There are many reasons for this, including beneficial policies, public awareness, a large number of potential early adopters and a mild climate. Even so, the EV heatmap of California done early shows that sales are mostly limited to the Bay Area, and LA areas.
The map shows data for total electric vehicle sales by state for years 2016, 2017 or 2018 and also the number of EV sales per 1000 licensed drivers (this is all people in the state with a drivers license, not drivers of EVs). If you hover over a state, you can see both data points for that state.
It will be interesting to see how the next generation of electric vehicles continues to improve, lower in price and become more popular with drivers outside of early adopters.
Click here to see other Energy-Related visualizations
Data and Tools:
Data on electric vehicle sales is from the Auto Alliance website. Licensed driver data was downloaded from the US Department of Transportation’s Bureau of Transportation Statistics website. The map was made using the leaflet open source mapping library. Data was compiled and calculated using javascript.
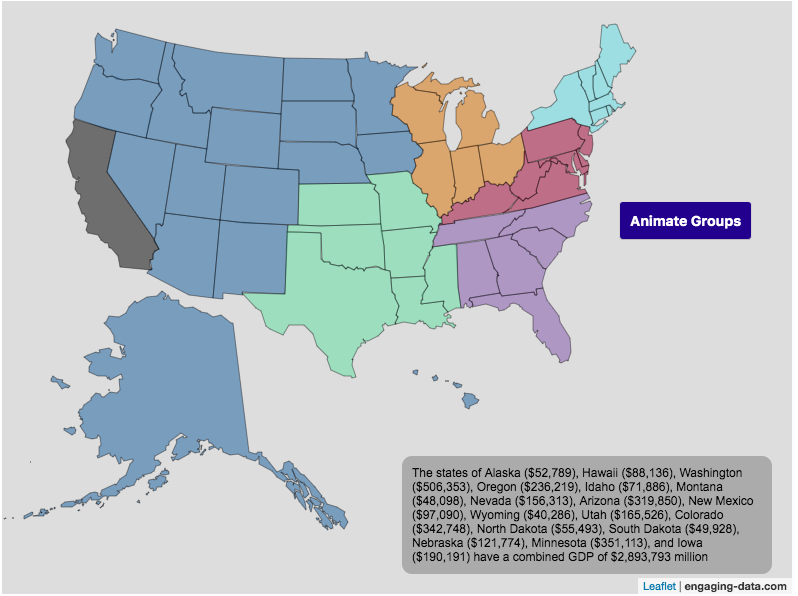
Size of California Economy Compared to Rest of US
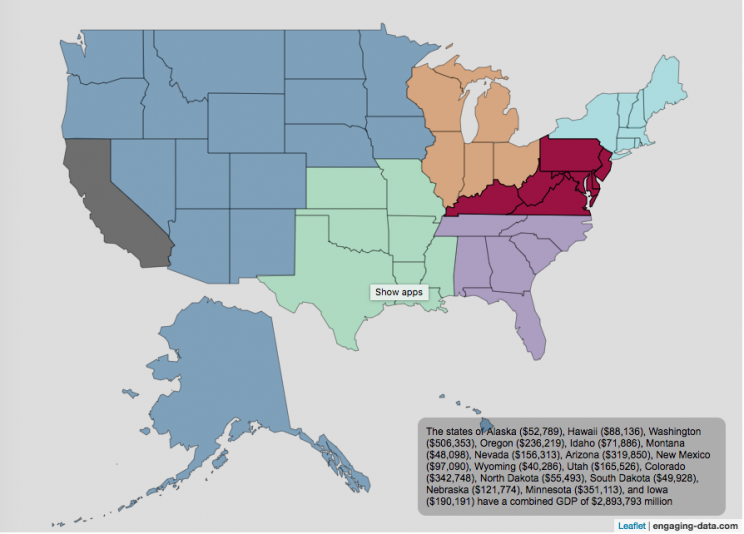
California is one of the world’s largest economies (as measured by gross domestic product), currently ranking 5th in the world (if it were judged as it’s own country). This map divides the rest of the US economy into 6 more or less equal parts (each the size of California’s) and they are all within about 10% of each other.
Instructions:
You can hover over a state with your cursor to get more information about the GDP of that state and the group of states that equal California’s economy.
Gross domestic product is a measurement of the size of a region’s economy. It is the sum of gross value added from all entities in the region or state. It measures the monetary value of the goods produced and services provided in a year.
The main sectors of the California economy are agriculture, technology, tourism, media (movies and TV) and trade. Some of the world’s largest and most famous companies contribute to the California economy, like Apple, Google, Facebook, Disney, and Chevron.
Data and Tools:
Data for state level GDP is obtained from Wikipedia for the year 2017. The map data is processed in javascript and then plotted using the leaflet.js mapping library.
California Snowpack Levels Visualization
How does the current California snowpack compare with Historical Averages?
If you are looking at this it’s probably winter in California and hopefully snowy in the mountains. In the winter, snow is one of the primary ways that water is stored in California and is on the same order of magnitude as the amount of water in reservoirs.
When I made this graph of California snowpack levels (Jan 2023) we’ve had quite a bit of rain and snow so far and so I wanted to visualize how this year compares with historical levels for this time of year. This graph will provide a constantly updated way to keep tabs on the water content in the Sierra snowpack.
Snow water content is just what it sounds like. It is an estimate of the water content of the snow. Since snow can have be relatively dry or moist, and can be fluffy or compacted, measuring snow depth is not as accurate as measuring the amount of water in the snow. There are multiple ways of measuring the water content of snow, including pads under the snow that measure the weight of the overlying snow, sensors that use sound waves and weighing snow cores.
I used data for California snow water content totals from the California Department of Water Resources. Other California water-related visualizations include reservoir levels in the state as well.
There are three sets of stations (and a state average) that are tracked in the data and these plots:
- Northern Sierra/Trinity – (32 snow sensors)
- Central Sierra – (57 snow sensors)
- Southern Sierra – (36 snow sensors)
- State-wide average – (125 snow sensors)
Here is a map showing these three regions.
These stations are tracked because they provide important information about the state’s water supply (most of which originates from the Sierra Nevada Mountains). Winter and spring snowpack forms an important reservoir of water storage for the state as this melting snow will eventually flow into the state’s rivers and reservoirs to serve domestic and agricultural water needs.
The visualization consists of a graph that shows the range of historical values for snow water content as a function of the day of the year. This range is split into percentiles of snow, spreading out like a cone from the start of the water year (October 1) ramping up to the peak in April and then converging back to zero in summertime. You can see the current water year plotted on this in red to show how it compares to historical values.
My numbers may differ slightly from the numbers reported on the state’s website. The historical percentiles that I calculated are from 1970 until 2022 while I notice the state’s average is between 1990 and 2020.
You can hover (or click) on the graph to audit the data a little more clearly.
Sources and Tools
Data is downloaded from the California Data Exchange Center website of the California Department of Water Resources using a python script. The data is processed in javascript and visualized here using HTML, CSS and javascript and the open source Plotly javascript graphing library.
California Rainfall Totals
How do current California rainfall and precipitation totals compare with Historical Averages?
If you are lookin at this visualization, it’s likely winter in California and that means the rainy season (snowy in the mountains). I wanted to visualize how the current year compares with historical levels for this time of year. I used data for California rainfall totals from the California Department of Water Resources. Other California water-related visualizations include reservoir levels in the state as well.
There are three sets of stations that are tracked in the data and these plots:
- Northern Sierra 8-station index
- Tulare Basin 6-station index
- San Joaquin 5-station index
These stations are tracked because they provide important information about the state’s water supply (most of which originates from the Sierra Nevada Mountains). Data from the CDEC website appears to be updated at around 8:30am PST each day.
The visualization consists of two primary graphs both of which show the range of historical values for precipitation. The top graph is a histogram of water year precipitation totals on the specified date (in blue) as well as the precipitation total for the current water year in red.
The second graph shows the percentiles of precipitation over the course of the historical water year, spreading out like a cone from the start of the water year (October 1). You can see the current water year plotted on this to show how it compares to historical values. It also shows the present precipitation level and its percentile within the historical data for the day of the water year.
You can hover (or click) on the graph to audit the data a little more clearly.
Sources and Tools
Data is downloaded from the California Data Exchange Center website of the California Department of Water Resources using a python script. The data is processed in javascript and visualized here using HTML, CSS and javascript and the open source Plotly javascript graphing library.
Wildfire smoke impacts solar panel generation
On September 9th, 2020, the entire San Francisco Bay Area, we had a crazy combination of wildfire smoke and low clouds that darkened the sky and turned everything orange. At 9am, it looked like it was nighttime and at noon, it was so dark, that it looked like dusk.
Here is a plot of 8+ years of solar panel generation from our panels. If you click on the legend, you can toggle whether that data is shown. Total generation for the day was only 93 watt hours (as opposed to a summer median of 13300 watt hours, 13.3 kWh) and peak power was only 32 watts (vs a median summer peak of 2000 watts (2.0 kW)).
The solar generation was even worse than the next worst day in winter (typically when it rains all day). Clicking on the legend will toggle whether certain seasons are shown and you can view how solar generation varies by season.
Here is a google image search of photos showing the crazy, apocalyptic scenes with the orange color.
Source and Tools:
Data on solar generation is downloaded from our solar panel inverter provider (enphase) and cleaned with a python script. Graph is made using the plotly open source javascript library.
Bay Area Coronavirus Cases
Compare the Bay Area coronavirus cases with Los Angeles and the rest of California
I wanted to better understand the coronavirus situation in my home region, the Bay Area, and I hadn’t seen any good resources that compared what was happening here to other regions in California. So I decided to make this graph. This page will be updated daily so you can come back regularly to see how the situation is changing (and hopefully improving sometime soon).
The coronavirus lockdowns began in mid-March 2020 and things have been opening up in late May, which corresponded to an uptick in coronavirus cases in the Bay Area and throughout California. While the cases in the Bay Area are increasing, it’s clear that there’s a big difference between the Bay Area and much of the rest of California. Los Angeles is currently leading the state with a large increase in the number of new cases in June as the economy tries to reopen restaurants, bars, gyms and other businesses.
You can toggle between coronavirus cases and deaths and look at the absolute numbers or on a per capita basis (per one million inhabitants). California has 39.5 million residents, while greater LA has 18.7 million residents and the Bay Area has 7.7 million residents. The daily data is shown as well as a five day moving average so you can get a better sense of the trends.
The San Francisco Bay Area was among the first regions to impose restrictions on gatherings and encourage people to stay home to fight the virus. In late February, the city of San Francisco declared an emergency in preparation for the upcoming pandemic and by early March, things became clear that life would not continue on as before.
The Bay Area is defined as the nine-county region consisting of Alameda, Contra Costa, Marin, Napa, San Francisco, San Mateo, Santa Clara, Solano and Sonoma counties.
Greater Los Angeles is defined as the 5 county region consisting of Los Angeles, Orange, Ventura, San Bernardino and Riverside counties.
Data and Tools:
County level data on coronavirus cases and deaths is from the New York Times github. Data is processed in python and javascript and graphed using the plotly open source graphing library.
Electric Vehicle Sales By State
Where are electric vehicles being sold in the United States?
Electric vehicles are any vehicle that can be plugged in to recharge a battery that provides power to move the vehicle. Two broad classes are battery electric vehicles (BEVs) which only have batteries as their power source and plug-in hybrid electric vehicles (PHEVs) which have an alternative or parallel power source, typically a gasoline engine. PHEVs are built so that when the battery is depleted, the car can still run on gasoline and operate like a hybrid vehicle similar to a regular Toyota Prius (which is not plugged in at all).
Electric vehicles (EVs) have been sold in the US since 2011 (a few commercial models were sold previous to that but not in any significant numbers) and some conversions were also available. Since then, the number of EVs sold has increased pretty significantly. I wanted to look at the distribution of where those vehicles were located. What is interesting is that California accounts for around 50% of the electric vehicles sold in the United States. Other states have lower rates of EV adoption (in some cases much, much lower). There are many reasons for this, including beneficial policies, public awareness, a large number of potential early adopters and a mild climate. Even so, the EV heatmap of California done early shows that sales are mostly limited to the Bay Area, and LA areas.
The map shows data for total electric vehicle sales by state for years 2016, 2017 or 2018 and also the number of EV sales per 1000 licensed drivers (this is all people in the state with a drivers license, not drivers of EVs). If you hover over a state, you can see both data points for that state.
It will be interesting to see how the next generation of electric vehicles continues to improve, lower in price and become more popular with drivers outside of early adopters.
Click here to see other Energy-Related visualizations
Data and Tools:
Data on electric vehicle sales is from the Auto Alliance website. Licensed driver data was downloaded from the US Department of Transportation’s Bureau of Transportation Statistics website. The map was made using the leaflet open source mapping library. Data was compiled and calculated using javascript.
Size of California Economy Compared to Rest of US
California is one of the world’s largest economies (as measured by gross domestic product), currently ranking 5th in the world (if it were judged as it’s own country). This map divides the rest of the US economy into 6 more or less equal parts (each the size of California’s) and they are all within about 10% of each other.
Instructions:
You can hover over a state with your cursor to get more information about the GDP of that state and the group of states that equal California’s economy.
Gross domestic product is a measurement of the size of a region’s economy. It is the sum of gross value added from all entities in the region or state. It measures the monetary value of the goods produced and services provided in a year.
The main sectors of the California economy are agriculture, technology, tourism, media (movies and TV) and trade. Some of the world’s largest and most famous companies contribute to the California economy, like Apple, Google, Facebook, Disney, and Chevron.
Data and Tools:
Data for state level GDP is obtained from Wikipedia for the year 2017. The map data is processed in javascript and then plotted using the leaflet.js mapping library.
Recent Comments