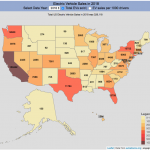
California is one of the leaders in the promotion and adoption of electric cars. It accounts for more than one quarter of the sales of electric vehicles in the US, despite having only 12% of the US population. This visualization shows the progress of adoption of electric vehicles (those that can be plugged in and run at least partially on energy stored in batteries). At the end of 2010 (2011 model year), a few companies started selling electric vehicles (including the Chevy Volt and Nissan Leaf) through their California Clean Vehicle Rebate Program (CA CVRP). California provides purchase incentives to buyers of electric vehicles (up to $5000/car depending on the battery size). And as of late-2018, over a quarter of a million electric vehicles have been sold in the state. This underlying data was downloaded from the CVRP website.
This visualization shows where those vehicles have been adopted. It probably comes as no surprise that most adoption of these vehicles comes in two major metropolitan areas (the SF Bay Area and Los Angeles). These are two regions that have a high proportion of early-adopters: those interested in green, advanced technologies and can afford these vehicles.
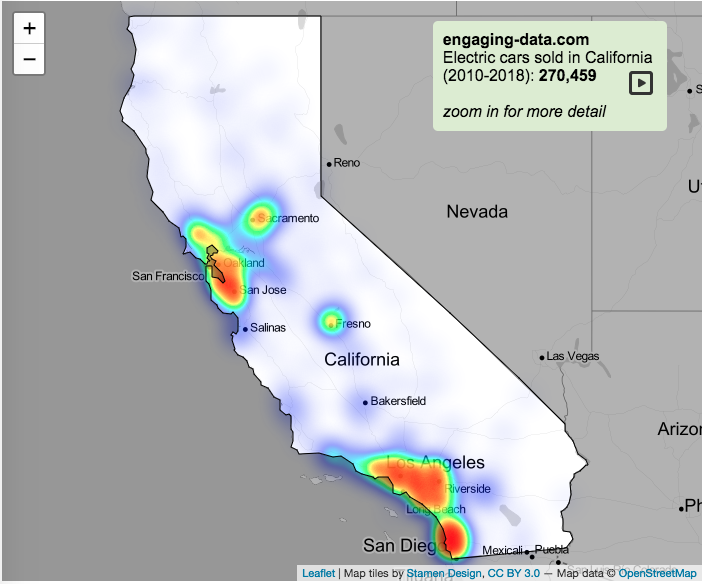
Press the  symbol in the infobox to animate the map showing years 2010 to 2018. Zoom in to see areas of higher sales in different cities in California.
Data and Tools:
Data is obtained from the California Clean Vehicle Rebate Program (CA CVRP). The data is downloaded and aggregated in MS Excel and the map is made using javascript and the leaflet.js library.
No Comments »