Posts for Tag: Electric Vehicles
Electric Vehicle Sales By State
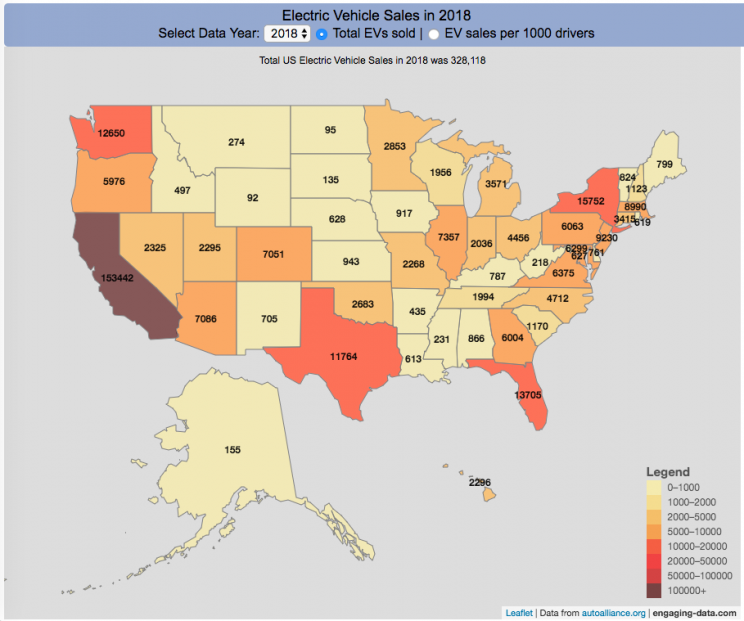
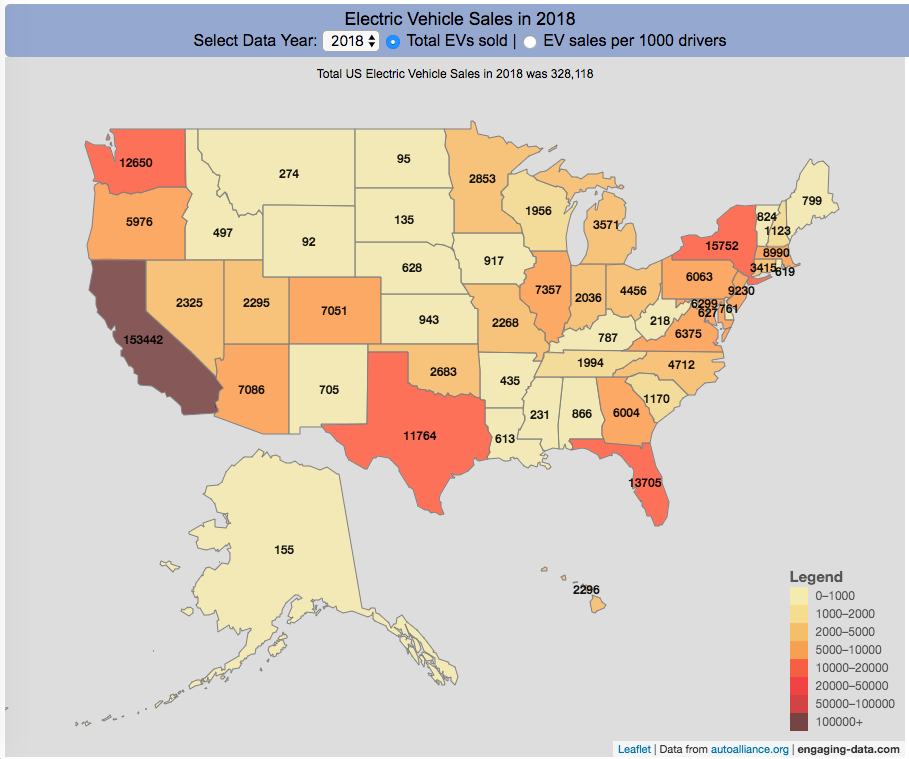
Where are electric vehicles being sold in the United States?
Electric vehicles are any vehicle that can be plugged in to recharge a battery that provides power to move the vehicle. Two broad classes are battery electric vehicles (BEVs) which only have batteries as their power source and plug-in hybrid electric vehicles (PHEVs) which have an alternative or parallel power source, typically a gasoline engine. PHEVs are built so that when the battery is depleted, the car can still run on gasoline and operate like a hybrid vehicle similar to a regular Toyota Prius (which is not plugged in at all).
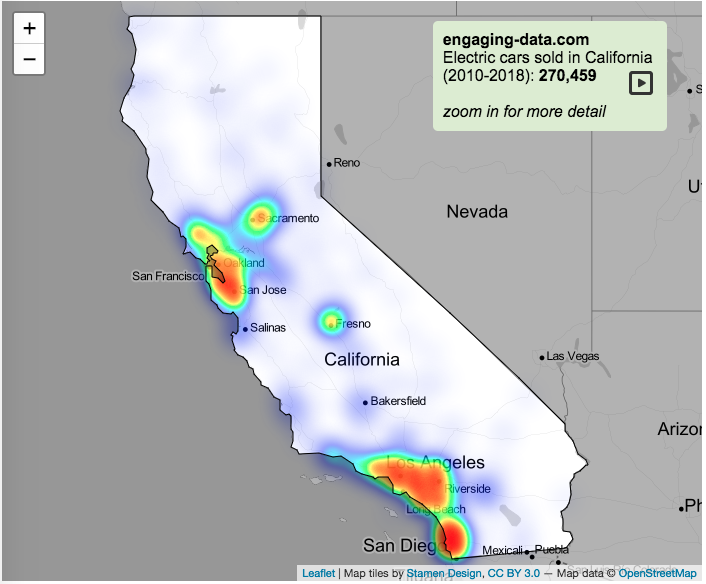
Electric vehicles (EVs) have been sold in the US since 2011 (a few commercial models were sold previous to that but not in any significant numbers) and some conversions were also available. Since then, the number of EVs sold has increased pretty significantly. I wanted to look at the distribution of where those vehicles were located. What is interesting is that California accounts for around 50% of the electric vehicles sold in the United States. Other states have lower rates of EV adoption (in some cases much, much lower). There are many reasons for this, including beneficial policies, public awareness, a large number of potential early adopters and a mild climate. Even so, the EV heatmap of California done early shows that sales are mostly limited to the Bay Area, and LA areas.
The map shows data for total electric vehicle sales by state for years 2016, 2017 or 2018 and also the number of EV sales per 1000 licensed drivers (this is all people in the state with a drivers license, not drivers of EVs). If you hover over a state, you can see both data points for that state.
It will be interesting to see how the next generation of electric vehicles continues to improve, lower in price and become more popular with drivers outside of early adopters.
Click here to see other Energy-Related visualizations
Data and Tools:
Data on electric vehicle sales is from the Auto Alliance website. Licensed driver data was downloaded from the US Department of Transportation’s Bureau of Transportation Statistics website. The map was made using the leaflet open source mapping library. Data was compiled and calculated using javascript.
Tesla Model 3 Sales Tracker
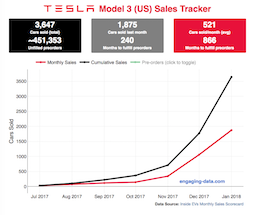
Tesla has been building innovative and industry-leading battery-powered cars for about a decade, starting with the Roadster, and then the Model S and Model X. The company unveiled the Model 3 (their first mass-market electric car with 220 miles of range, priced at “$35,000″), in early 2017 and hundreds of thousands of people put down a $1000 deposit within a few days. Overall, the number of these pre-orders total about half a million! It was impressive for a car most people have not driven or even seen.
The company also has had optimistic timeframes for producing and shipping these vehicle: they had originally estimated production rates of 5000 cars/week by the end of 2017 and 10,000 cars/week(!) in 2018. That’s Civic or Camry levels. These have since been delayed due to reports of “production hell” in scaling up mass production for the vehicles. Given the unprecedented demand and production challenges as Tesla transitions from niche automaker to mass-market production, I thought it would be worthwhile to track the sales of Model 3s as they are built and shipped to customers with the Model 3 Sales Tracker. Average sales price has been far above the $35,000 price initially announced. Production has reportedly passed 5000 cars/week intermittently, if not continuously, in the summer of 2018.
Electric Vehicle Sales By State
Where are electric vehicles being sold in the United States?
Electric vehicles are any vehicle that can be plugged in to recharge a battery that provides power to move the vehicle. Two broad classes are battery electric vehicles (BEVs) which only have batteries as their power source and plug-in hybrid electric vehicles (PHEVs) which have an alternative or parallel power source, typically a gasoline engine. PHEVs are built so that when the battery is depleted, the car can still run on gasoline and operate like a hybrid vehicle similar to a regular Toyota Prius (which is not plugged in at all).
Electric vehicles (EVs) have been sold in the US since 2011 (a few commercial models were sold previous to that but not in any significant numbers) and some conversions were also available. Since then, the number of EVs sold has increased pretty significantly. I wanted to look at the distribution of where those vehicles were located. What is interesting is that California accounts for around 50% of the electric vehicles sold in the United States. Other states have lower rates of EV adoption (in some cases much, much lower). There are many reasons for this, including beneficial policies, public awareness, a large number of potential early adopters and a mild climate. Even so, the EV heatmap of California done early shows that sales are mostly limited to the Bay Area, and LA areas.
The map shows data for total electric vehicle sales by state for years 2016, 2017 or 2018 and also the number of EV sales per 1000 licensed drivers (this is all people in the state with a drivers license, not drivers of EVs). If you hover over a state, you can see both data points for that state.
It will be interesting to see how the next generation of electric vehicles continues to improve, lower in price and become more popular with drivers outside of early adopters.
Click here to see other Energy-Related visualizations
Data and Tools:
Data on electric vehicle sales is from the Auto Alliance website. Licensed driver data was downloaded from the US Department of Transportation’s Bureau of Transportation Statistics website. The map was made using the leaflet open source mapping library. Data was compiled and calculated using javascript.
Tesla Model 3 Sales Tracker
Tesla has been building innovative and industry-leading battery-powered cars for about a decade, starting with the Roadster, and then the Model S and Model X. The company unveiled the Model 3 (their first mass-market electric car with 220 miles of range, priced at “$35,000″), in early 2017 and hundreds of thousands of people put down a $1000 deposit within a few days. Overall, the number of these pre-orders total about half a million! It was impressive for a car most people have not driven or even seen.
The company also has had optimistic timeframes for producing and shipping these vehicle: they had originally estimated production rates of 5000 cars/week by the end of 2017 and 10,000 cars/week(!) in 2018. That’s Civic or Camry levels. These have since been delayed due to reports of “production hell” in scaling up mass production for the vehicles. Given the unprecedented demand and production challenges as Tesla transitions from niche automaker to mass-market production, I thought it would be worthwhile to track the sales of Model 3s as they are built and shipped to customers with the Model 3 Sales Tracker. Average sales price has been far above the $35,000 price initially announced. Production has reportedly passed 5000 cars/week intermittently, if not continuously, in the summer of 2018.
Recent Comments