The fires in Napa and Santa Rosa California have been burning for about a week and a half so far and these fires have resulted in numerous deaths (with many more missing), significant property damage (over 4000 buildings), and forced the evacuation of tens of thousands from their homes. Luckily, these fires are mostly contained at this point with incredible work from firefighters and as well as from the weather (link to fire status on the CalFire’s websites on the Tubbs, Atlas, Nuns fires).
This has brought down the amount of smoke and improved the air quality in the immediate and surrounding areas. While the poor air quality effects on people are relatively small compared to the impact of those whose lives and property were destroyed, the air quality impact from these fires has still been significant, from closed schools, canceled athletic events, and burning eyes and throat from the particulate matter.
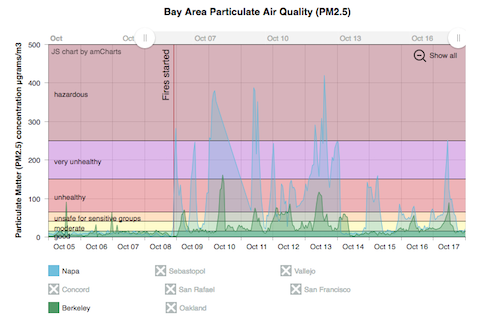
This post focuses on the concentration of PM2.5, particulate matter that is smaller than 2.5 microns (millionths of a meter) in size. These tiny particles produced from the fires have a big impact on human health because they are suspended in the air for so long (because they are so small and light), and are likely to make it all the way into the lungs when breathed (as opposed to larger particles which may get caught in the nose or throat).
The graph shows the concentration of PM2.5 in the air at several different sampling locations across the Bay Area. You can click on the legend to show or hide specific locations. The sampling stations closest to the fires were Napa and Sebastopol. In many parts of the Bay Area further away from the fires, the concentrations reached the unhealthy or very unhealthy levels (up to 250 μg/m3 (micrograms per cubic meter of air)). In Napa especially you can see it reached hazardous levels (up to 400 μg/m3). You can also see that levels of PM2.5 before the fires started on October 8th.
One interesting thing about the data and visualization is that the spikes in PM2.5 concentration seem to occur in the mornings. I’m not entirely sure what the cause of that is, except that it must be related to wind patterns.
If you’d like to help the victims of these fires (or other natural disasters), please consider a donation to the American Red Cross.
UPDATE: The air quality has improved considerably as of Oct 19th which coincided with a change in weather and fire status. Air quality appears mostly normal at this point.
Data is from the California Air Resources Board, and data organization and visualization is done with python, excel and javascript. I will keep the graphs updated until the major impacts of the fires have passed.

No Comments »