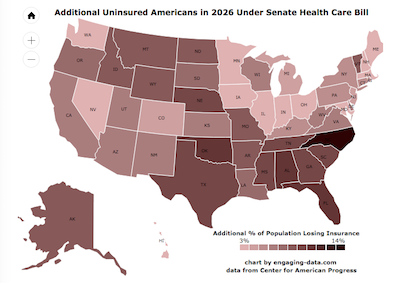
The Congressional Budget Office (CBO) released a report that analyzed the impacts of the Senate health care bill and estimated that 22 million Americans would lose health care by 2026 (see previous post). 22 million amounts to almost 7% of the US population (about 1 in 15 Americans). I wondered how the impacts of these changes would be distributed across different states.
The Center for American Progress took the CBO estimate of reductions in the number of insured Americans and estimated how these losses would be distributed state-by-state, and even by congressional district.
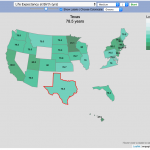
I created a color-coded interactive map (also called a choropleth map or heat map) of the 50 states showing the percentage of the the state population that will lose their insurance as a result of the Senate health care bill. North Carolina, Florida and Oklahoma all have 10+% losses in insurance coverage, while Minnesota, Maryland, New Hampshire and North Dakota all have less than 4% losses.
Data: Center for American Progress (CAP) and Congressional Budget Office (CBO)
Visualized: Javascript maps (AmMaps)
Related Posts
No Comments »
