The coronavirus (SARS-CoV-2) is literally affecting the entire globe right now and changing the way we live our lives here in the US and all over the world.
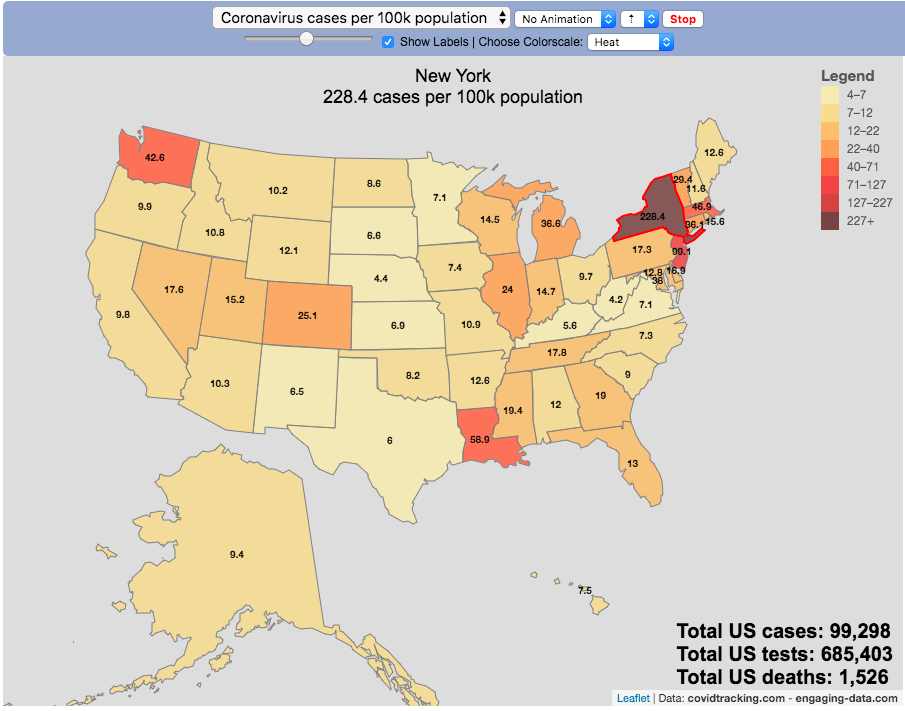
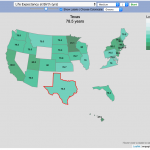
There are quite a number of different coronavirus-related dataviz out there, but as we shelter-in-place I wanted to add a map that looked at a number of different metrics that tell us about the coronavirus pandemic by US states and look at those metrics on a population basis.
There are a number of data sources that I’ve found that publish data about the coronavirus and the resulting disease (Covid-19) in the United States:
This map is based on the data compiled from covidtracking.com, partly because it has a good API and also lists testing, cases and deaths. The data I’ve included on the map is:
- Numbers of coronavirus cases – i.e. tested positive for virus
- Numbers of coronavirus tests administered
- Numbers of deaths due to coronavirus
Each of these is also calculated per 100,000 population in the state:
- Numbers of coronavirus cases per 100k people- i.e. tested positive for virus
- Numbers of coronavirus tests administered per 100k people
- Numbers of deaths due to coronavirus per 100k people
These latter metrics are important because numbers of cases or deaths can be obscured by small or large populations but per capita data (or per 100k capita data) can point out interesting outliers.
It is important to note that the data is far from perfect. There is probably significant underreporting of tests, cases and deaths. The data is a collection for the various local and state agencies that are working hard to deal with the medical, social and political ramifications of the pandemic, while also collecting data. We don’t know how many Americans have coronavirus because of lack of testing.
Also important is that the number of positive cases is a function of how much testing is taking place so cases does not necessarily represent the exact prevalence of the virus, though there will probably be good correlation between cases and actual coronavirus infections. Luckily it sounds like tests are becoming more widely available so hopefully those numbers will go up sharply.
For more information about the virus and the disease and data collection, you can find good information on the CDC website.
Sources and Tools:
Coronavirus cases are obtained from covidtracking.com. And the visualization was created using javascript and the open source leaflet javascript mapping library.
No Comments »