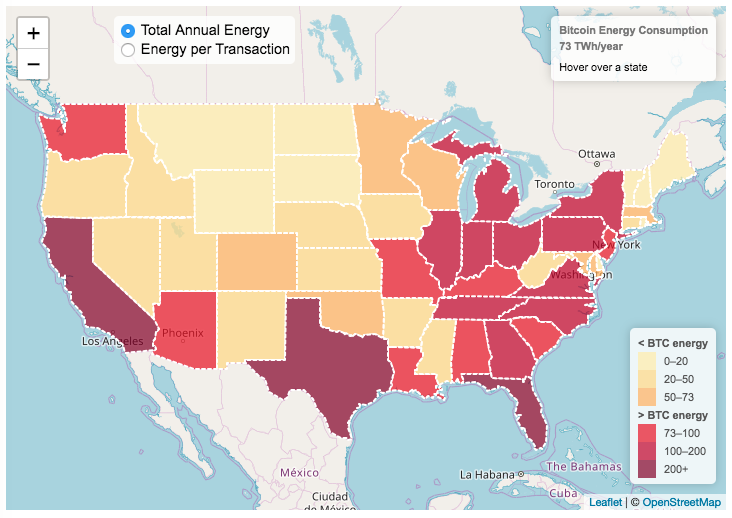
This visualization looks at the staggeringly high energy use of Bitcoin and puts it into context: comparing it to electricity usage of US states. Unfortunately for Bitcoin, high energy usage is an intended feature of the system, rather than an unintended consequence. This is because mining is an increasingly energy intensive process, based upon increasingly computationally intensive calculations that are performed on high powered computers and graphical processing units.
Currently, 28 out of 50 states plus the District of Columbia all have lower electricity consumption than estimated annual bitcoin electricity consumption (~73 TWh per year). These states are highlighted in variations of yellow. This is approximately equal to the average annual electricity usage across all US States. States with higher electricity consumption than bitcoin are highlighted in shades of red.
When dividing the total energy use (73 TWh) by the current number of transactions (93 million), we get an average energy consumption of 783 kWh per transaction. Click on the “Energy per Transaction” button to see this visualization. What’s crazy is that a transaction is simply a transfer of bitcoin between “wallets”, recording the transaction, and a validation of the process. There’s no good reason why verifying digital transactions should take this much energy, except that it was built into the fundamental process of validating and mining bitcoin. 783 kWh is larger than the monthly per capita electricity consumption in 10 US states. It could also drive you and your family over 2000 miles in an electric car (e.g. Tesla Model S).
I’m not expert enough in this area to know how much more energy consumption will rise into the future, but if crypto advocates’ predictions come true and bitcoin is used extensively, millions of transactions will occur per hour instead of per year and the price of bitcoin may rise much higher than it currently is. If the price rises, then miners will be willing to expend more energy to “mine” the more valuable bitcoin. Needless to say, this sounds like a very bad idea from an energy consumption and sustainability standpoint.
Data and Tools:
State energy data comes from the US Department of Energy. Estimates of Bitcoin energy use come from Digiconomist’s Bitcoin Energy Consumption Index. The choropleth map is visualized using javascript and the Leaflet.js library with Open Street Map tiles.

No Comments »