CO2 emissions are the primary contributor to our current ‘climate crisis’. Because of buildup of heat-trapping nature of CO2 and other greenhouse gases in the atmosphere, temperatures are rising and weather and precipitation patterns are changing. Changes in climate will have profound impacts on both natural systems and our human landscapes.
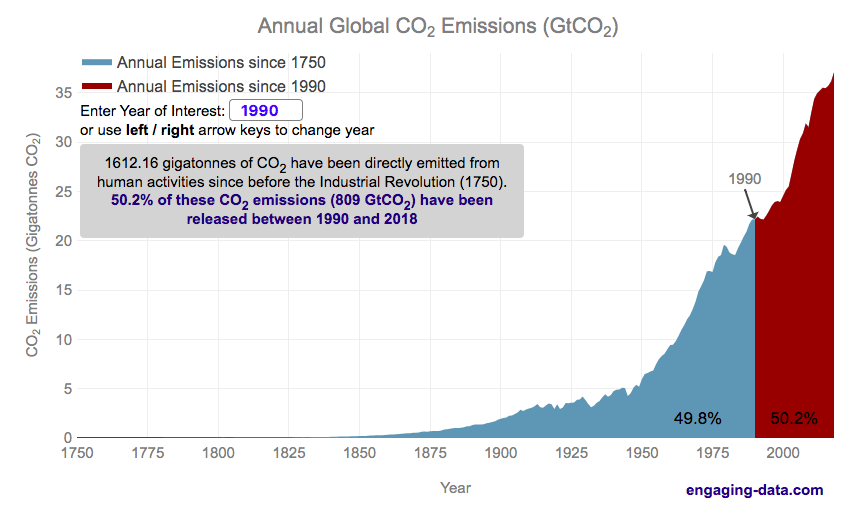
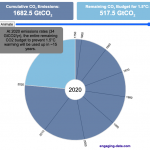
Significant emissions of CO2 really started in the industrial revolution. This is when humans really started using significant quantities of non-renewable energy sources, mainly fossil fuels such as coal and later natural gas and oil. The increase in the burning of hydrocarbon energy sources for powering factories and transportation lead to growing CO2 emissions. The following graph shows the annual emissions of CO2 since 1750, before the start of the industrial revolution. In this period of 269 years, humans have emitted 1600 billion tonnes of CO2 (1600 gigatonnes). One incredible fact is that due to rapid growth in population and energy use per capita over time, we are emitting more and more CO2 each year and that humans have emitted as much in the last 28 years than in the 240 years prior to that.
Calculate CO2 emissions since <insert date>
Instructions
The global median age is around 30 years old (i.e. half the people on earth were born after 1989). This means that more than half of the earth’s population has seen the global cumulative CO2 emissions double in their lifetime. Also very striking is that in my children’s lifetimes (around a decade), humanity has added nearly 1/5 of all human produced CO2 ever to the atmosphere.
Notes: Emissions are in units of gigatonnes of CO2. To convert to gigatons of carbon, another common unit of measuring carbon emissions, divide by 3.666.
Data source and Tools
Annual emissions data is from the Global Carbon Project. The data is processed in javascript and plotted using the open-source, javascript plotting library, Plotly.
1 Comment »
One Response to Cumulative CO2 emissions calculator
It would be fun if there is an animation