Posts for Tag: CO2
Cumulative CO2 emissions calculator
CO2 emissions are the primary contributor to our current ‘climate crisis’. Because of buildup of heat-trapping nature of CO2 and other greenhouse gases in the atmosphere, temperatures are rising and weather and precipitation patterns are changing. Changes in climate will have profound impacts on both natural systems and our human landscapes.
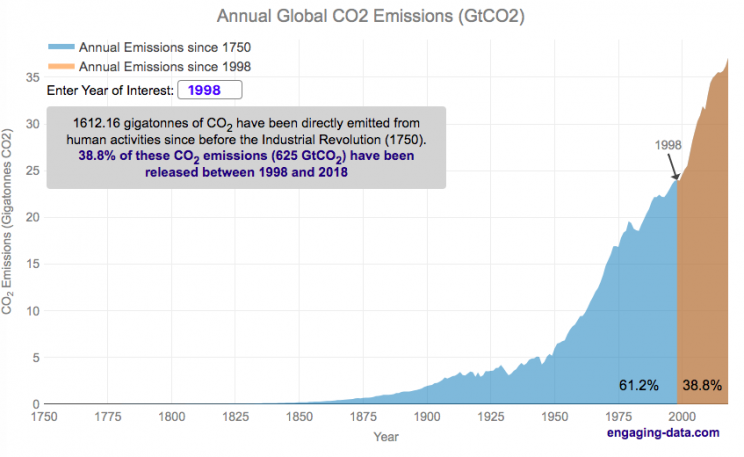
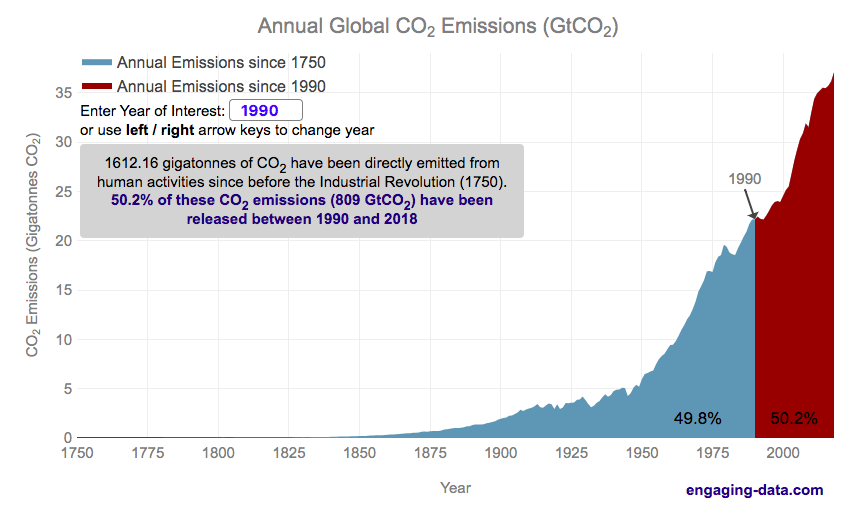
Significant emissions of CO2 really started in the industrial revolution. This is when humans really started using significant quantities of non-renewable energy sources, mainly fossil fuels such as coal and later natural gas and oil. The increase in the burning of hydrocarbon energy sources for powering factories and transportation lead to growing CO2 emissions. The following graph shows the annual emissions of CO2 since 1750, before the start of the industrial revolution. In this period of 269 years, humans have emitted 1600 billion tonnes of CO2 (1600 gigatonnes). One incredible fact is that due to rapid growth in population and energy use per capita over time, we are emitting more and more CO2 each year and that humans have emitted as much in the last 28 years than in the 240 years prior to that.
Calculate CO2 emissions since <insert date>
Instructions
The interactive visualization lets you enter any year between 1750 and 2021 and it will show the relative proportion of human CO2 before and after that year.
You can also use the left and right arrow keys to change the year up and down
If you hover over the graph you can see the annual and cumulative emission for each individual year in the graph
If you want to share the visualization with a specific year highlighted, you can add the following to the URL “?yr=yyyy” where yyyy is the four digit year (e.g. https://engaging-data.com/most-emissions-last-30-years/?yr=1980).
The global median age is around 30 years old (i.e. half the people on earth were born after 1989). This means that more than half of the earth’s population has seen the global cumulative CO2 emissions double in their lifetime. Also very striking is that in my children’s lifetimes (around a decade), humanity has added nearly 1/5 of all human produced CO2 ever to the atmosphere.
Notes: Emissions are in units of gigatonnes of CO2. To convert to gigatons of carbon, another common unit of measuring carbon emissions, divide by 3.666.
Data source and Tools
Annual emissions data is from the Global Carbon Project. The data is processed in javascript and plotted using the open-source, javascript plotting library, Plotly.
Visualizing The Growth of Atmospheric CO2 Concentration
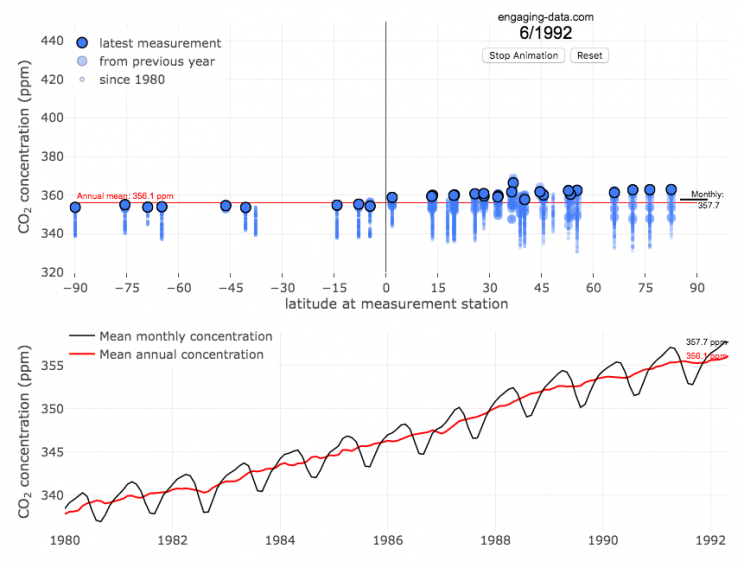
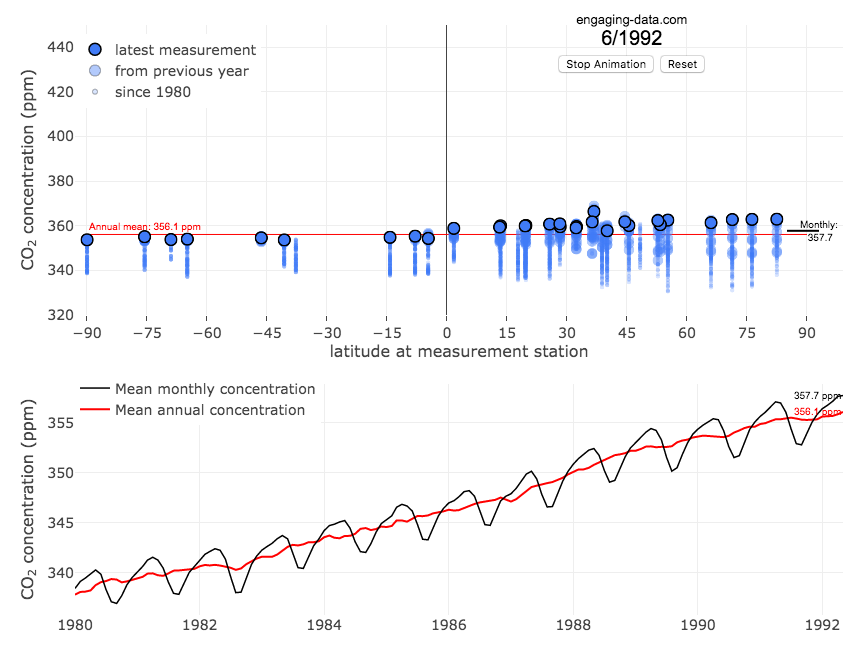
The current CO2 concentration in the atmosphere is over 400 parts per million (ppm). This has grown about 46% since pre-industrial levels (~280 ppm) in the early 1800s. The growing concentration of CO2 is a big concern because it is the most prevalent greenhouse gas, which is increasing the temperature of the planet and leading to substantial changes in the Earth’s climate patterns.
This graph visualizes the growth in CO2 concentration in the atmosphere (mainly from CO2 emissions due to human activities, such as burning fossil fuels for energy production, deforestation and other industrial processes). The graph starts at 1980 when CO2 concentration in the atmosphere was around 340ppm. It has grown significantly since then.
One of the interesting aspects of CO2 concentration is that it is not identical all around the globe, as it takes awhile for the atmosphere to mix. The graph shows geographic differences in CO2 concentration as well as seasonal ups and downs, that underly an overall growing trend in annual average (mean) concentration.
Seasonal trends in CO2 concentration occur due to differences in the amount of plant growth across different months. Spring and summer plant growth in the northern hemisphere causes a significant amount of photosynthesis, and CO2 absorption, relative to the fall and winter. This plant growth causes a very large amount of CO2 to be absorbed by plants and a noticeable reduction in the amount of CO2 in the atmosphere. The southern hemisphere spring and summer (northern hemisphere fall and winter) aren’t as obvious because there is much less land in the southern hemisphere and the land that is there is close to the tropics and green all year round.
CO2 concentration can change by about 4-5 ppm due to the “breathing” of plants, which is pretty significant. The total weight of CO2 in the atmosphere is about 3 trillion tonnes of CO2, so 4-5 ppm is about 1% of this or 30 billion tons of CO2 removed by plant life each spring/summer.
Data and Tools:
Data comes from the US National Oceanic and Atmospheric Administration (NOAA). Data was downloaded using an automated python script and the graphs were made using javascript and the open-sourced Plot.ly javascript engine.
Cumulative CO2 emissions calculator
CO2 emissions are the primary contributor to our current ‘climate crisis’. Because of buildup of heat-trapping nature of CO2 and other greenhouse gases in the atmosphere, temperatures are rising and weather and precipitation patterns are changing. Changes in climate will have profound impacts on both natural systems and our human landscapes.
Significant emissions of CO2 really started in the industrial revolution. This is when humans really started using significant quantities of non-renewable energy sources, mainly fossil fuels such as coal and later natural gas and oil. The increase in the burning of hydrocarbon energy sources for powering factories and transportation lead to growing CO2 emissions. The following graph shows the annual emissions of CO2 since 1750, before the start of the industrial revolution. In this period of 269 years, humans have emitted 1600 billion tonnes of CO2 (1600 gigatonnes). One incredible fact is that due to rapid growth in population and energy use per capita over time, we are emitting more and more CO2 each year and that humans have emitted as much in the last 28 years than in the 240 years prior to that.
Calculate CO2 emissions since <insert date>
Instructions
The global median age is around 30 years old (i.e. half the people on earth were born after 1989). This means that more than half of the earth’s population has seen the global cumulative CO2 emissions double in their lifetime. Also very striking is that in my children’s lifetimes (around a decade), humanity has added nearly 1/5 of all human produced CO2 ever to the atmosphere.
Notes: Emissions are in units of gigatonnes of CO2. To convert to gigatons of carbon, another common unit of measuring carbon emissions, divide by 3.666.
Data source and Tools
Annual emissions data is from the Global Carbon Project. The data is processed in javascript and plotted using the open-source, javascript plotting library, Plotly.
Visualizing The Growth of Atmospheric CO2 Concentration
The current CO2 concentration in the atmosphere is over 400 parts per million (ppm). This has grown about 46% since pre-industrial levels (~280 ppm) in the early 1800s. The growing concentration of CO2 is a big concern because it is the most prevalent greenhouse gas, which is increasing the temperature of the planet and leading to substantial changes in the Earth’s climate patterns.
This graph visualizes the growth in CO2 concentration in the atmosphere (mainly from CO2 emissions due to human activities, such as burning fossil fuels for energy production, deforestation and other industrial processes). The graph starts at 1980 when CO2 concentration in the atmosphere was around 340ppm. It has grown significantly since then.
One of the interesting aspects of CO2 concentration is that it is not identical all around the globe, as it takes awhile for the atmosphere to mix. The graph shows geographic differences in CO2 concentration as well as seasonal ups and downs, that underly an overall growing trend in annual average (mean) concentration.
Seasonal trends in CO2 concentration occur due to differences in the amount of plant growth across different months. Spring and summer plant growth in the northern hemisphere causes a significant amount of photosynthesis, and CO2 absorption, relative to the fall and winter. This plant growth causes a very large amount of CO2 to be absorbed by plants and a noticeable reduction in the amount of CO2 in the atmosphere. The southern hemisphere spring and summer (northern hemisphere fall and winter) aren’t as obvious because there is much less land in the southern hemisphere and the land that is there is close to the tropics and green all year round.
CO2 concentration can change by about 4-5 ppm due to the “breathing” of plants, which is pretty significant. The total weight of CO2 in the atmosphere is about 3 trillion tonnes of CO2, so 4-5 ppm is about 1% of this or 30 billion tons of CO2 removed by plant life each spring/summer.
Data and Tools:
Data comes from the US National Oceanic and Atmospheric Administration (NOAA). Data was downloaded using an automated python script and the graphs were made using javascript and the open-sourced Plot.ly javascript engine.
Recent Comments