How much do US households spend and how does it change with age?
This visualization is one of a series of visualizations that present US household spending data from the US Bureau of Labor Statistics. This one looks at the age of the primary resident.
- US Household spending by income group
- US Household spending by age of primary resident
- US Household spending by education level of primary resident
- US Household spending by household composition
This visualization focuses on the age of the primary resident. This is defined in the BLS documentation as the person who is first mentioned when the survey respondent is asked who in the household rents or owns the home.
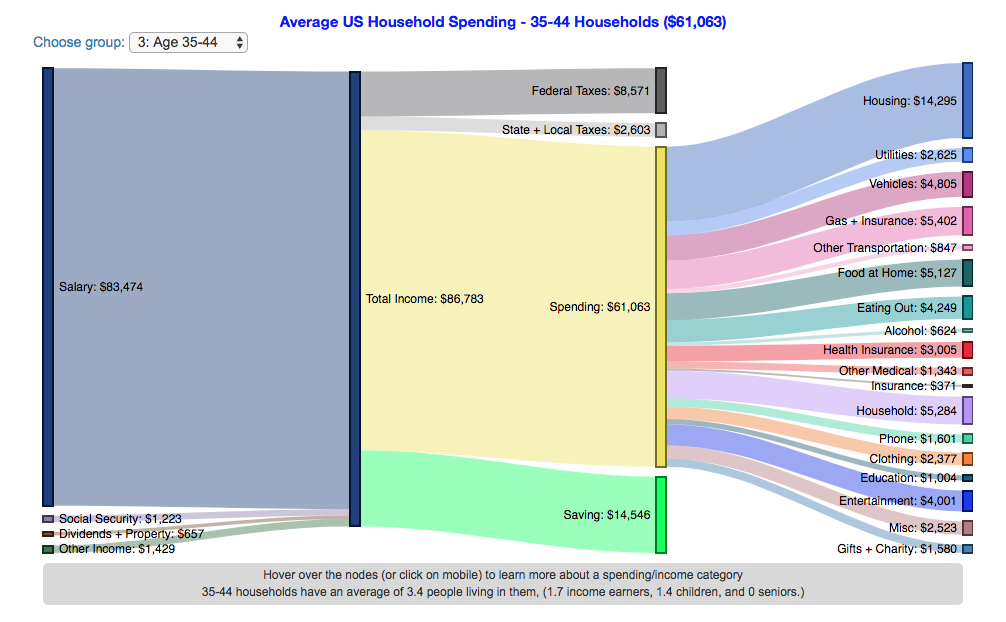
I obtained data from the US Bureau of Labor Statistics (BLS), based upon a survey of consumer households and their spending habits. This data breaks down spending and income into many categories that are aggregated and plotted in a Sankey graph.
One of the key factors in financial health of an individual or household is making sure that household spending is equal to or below household income. If your spending is higher than income, you will be drawing down your savings (if you have any) or borrowing money. If your spending is lower than your income, you will presumably be saving money which can provide flexibility in the future, fund your retirement (maybe even early) and generally give you peace of mind.
Instructions:
- Hover (or on mobile click) on a link to get more information on the definition of a particular spending or income category.
- Use the dropdown menu to look at averages for different groups of households based on the age of the primary resident. This data breaks households into groups (under 25, 25-34, 35-44, 45-54, 55-64, 65-75 and over 75). The composition of households and income change as the age of the primary resident changes, which in turn affects spending totals and individual categories.
As stated before, one of the keys to financial security is spending less than your income. We can see that on average, income tends to increase with the household primary age up to the 45-54 group, then declines from there.
The youngest group (under 25) tends to borrow or draw down on savings to live their lifestyle, while the same is true of the over 75 age group. This is probably because seniors tend to draw down savings that were built up specifically for this purpose, and college students borrow to go to school. Social security also makes up a big portion of income for the older age groups.
How does your overall spending compare with those in your income group? How about spending in individual categories like housing, vehicles, food, clothing, etc…?
Probably one of the best things you can do from a financial perspective is to go through your spending and understand where your money is going. These sankey diagrams are one way to do it and see it visually, but of course, you can just make a table or pie chart or whatever.
The main thing is to understand where your money is going. Once you’ve done this you can be more conscious of what you are spending your money on, and then decide if you are spending too much (or too little) in certain categories. Having context of what other people spend money on is helpful as well, and why it is useful to compare to these averages, even though the income level, regional cost of living, and household composition won’t look exactly the same as your household.
**Click Here to view other financial-related tools and data visualizations from engaging-data**
Here is more information about the Consumer Expenditure Surveys from the BLS website:
The Consumer Expenditure Surveys (CE) collect information from the US households and families on their spending habits (expenditures), income, and household characteristics. The strength of the surveys is that it allows data users to relate the expenditures and income of consumers to the characteristics of those consumers. The surveys consist of two components, a quarterly Interview Survey and a weekly Diary Survey, each with its own questionnaire and sample.
Data and Tools:
Data on consumer spending was obtained from the BLS Consumer Expenditure Surveys, and aggregation and calculations were done using javascript and code modified from the Sankeymatic plotting website. I aggregated many of the survey output categories so as to make the graph legible, otherwise there’d be 4x as many spending categories and all very small and difficult to read.
Related Posts
 How do Americans Spend Money? US Household Spending Breakdown by Income Group
 How do Americans Spend Money? US Household Spending Breakdown by Household Composition
 How do Americans Spend Money? US Household Spending Breakdown by Education Level
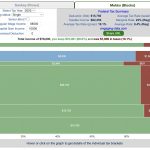 Tax Brackets v2.0: Interactive Income Tax Visualization and Calculator
1 Comment »
One Response to How do Americans Spend Money? US Household Spending Breakdown by Age
[…] data visualizations in today’s post come to us from Engaging Data and they use Sankey diagrams to display data from the Bureau of Labor Statistics (BLS) showing […]