Animation and Description of the Moon Phases
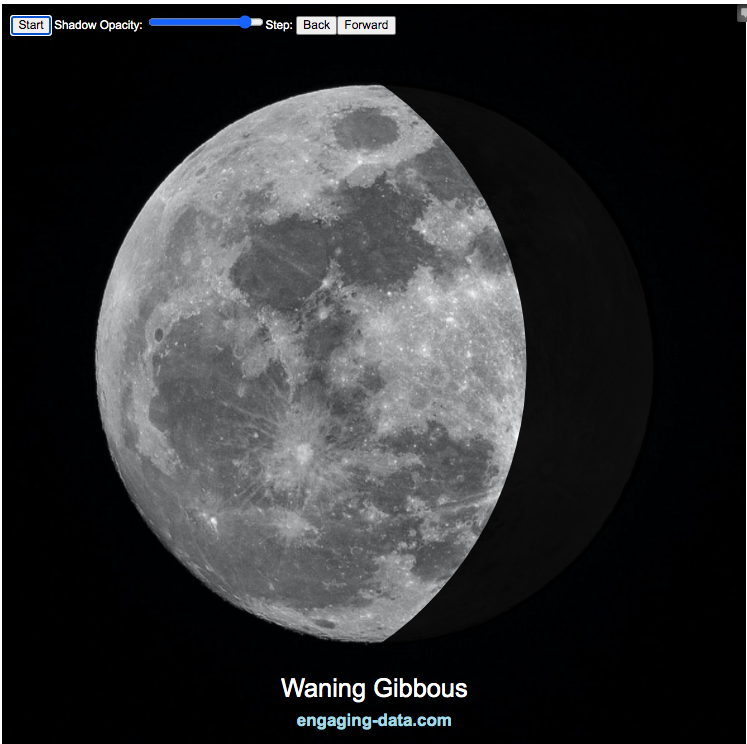
This visualization shows the phases of the moon. It’s a fairly simple visualization that shows a photo of the moon and covers it with a shadow to show only the lit up portion of the moon. Half of the moon is always lit up (half of the sphere) but we can usually only see part of the lit up portion.
Controls
You can use the slider to control the opacity of the shadow. There is a button that lets you start and stop the animation and you can also step through the animation with the ‘Back’ and ‘Forward’ buttons or the left and right arrow keys.
Moon Phases
- Full Moon – we can see the entire lit up portion of the moon
- New Moon we can’t see any of the lit up part (moon is dark when viewing from Earth).
- Waxing – refers to the moon when the lit up portion is getting bigger (i.e. we can see more of it each subsequent day)
- Waning – refers to the moon when the lit up portion is getting smaller (i.e. we see less of it each subsequent day)
- Crescent – is when the visible moon is less than half lit up
- Gibbous – is when the visible portion of the moon is more than half lit
- Quarter Moon – when the visible portion of the moon is exactly half of the circle
These are combined to get eight different distinct phases:
- Waxing Crescent
- Quarter Moon
- Waxing Gibbous
- Full Moon
- Waning Gibbous
- Quarter Moon
- Waning Crescent
- New Moon
The moon goes through these phases once every 29.5 days. Because it’s not exactly a whole number of days, the size of each crescent isn’t exactly the same each lunar cycle. The rate of change in the size of the lit up portion of the moon is fastest when the moon is close to a quarter moon and slowest when the moon is closest to a new moon or full moon. This has to do with the way the light is projected onto a 3D sphere but viewed as a 2D disc.
Data Sources and Tools:
The moon image was downloaded from unsplash.com and taken by Mike Petrucci representing Delaware. The code to determine the size and draw the shadow was written in javascript and d3 open source data visualization library.
No Comments »