How is your income distributed across tax brackets?
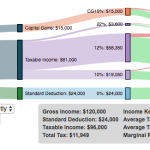
This updated visualization is a detailed look at the breakdown how taxes are applied to your income across each of the tax brackets. The previous version of this visualization was a Sankey graph and this new version combines the sankey view with a mekko (or marimekko) graph view. It should help you to better understand marginal and average tax rates. This tool only looks at US Federal Income taxes and ignores state, local and Social Security/Medicare taxes.
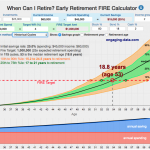
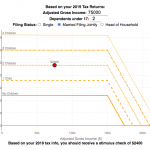
**Click Here to view other financial-related tools and data visualizations from engaging-data**
Instructions for using the visual tax calculator:
- Tax Year: Select year from list of years as bracket sizes and deduction changes by year
- Select filing status: Single, Married Filing Jointly or Head of Household. For more info on these filing categories see the IRS website
- Senior checkbox Seniors are eligible for additional standard deduction and from 2025-2028 eligible for additional deduction even if you itemize
- Enter your regular income and capital gains income. Regular income is wage or employment income and is taxed at a higher rate than capital gains income. Capital gains income is typically investment income from the sale of stocks or dividends and taxed at a lower rate than regular income.
- Move your cursor or click on the Sankey graph to select a specific link. This will give you more information about how income in a specific tax bracket is being taxed.
- Itemized deduction Enter the amount of itemized deductions you have including: state and local (property) taxes, mortgage interest, charitable contributions and medical expenses above 7.5% of your AGI
Interpreting the tax visualization graphs
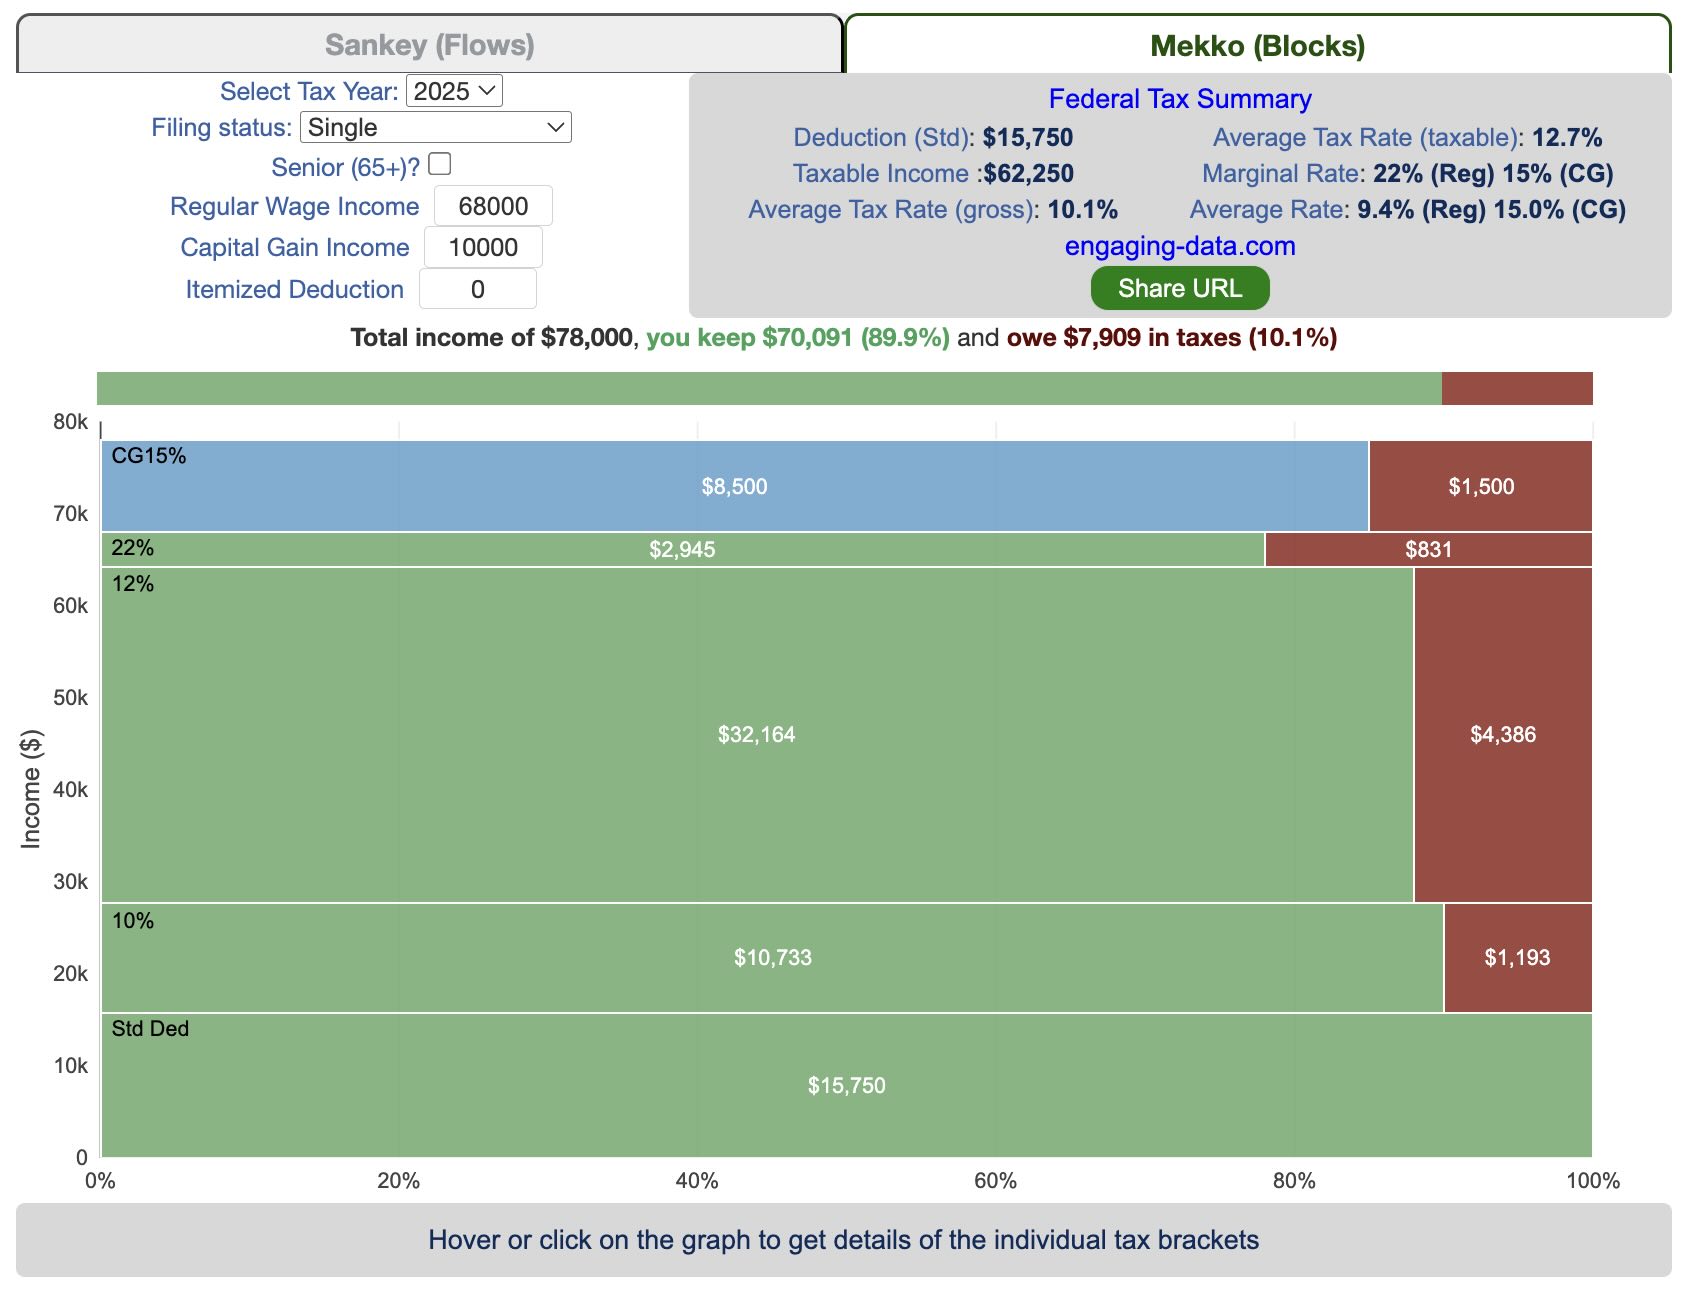
Both the sankey and mekko graphs help you easily the size each of these tax brackets and the fraction of income in that bracket that you can keep and the fraction going to taxes. Also shown is the split of the regular income vs capital gains and how capital gains is “stacked” on top of the regular income.
The mekko graph is a stacked horizontal bar graph where the height of each bar is proportional to the size of the tax bracket and the bar is split into two parts: a keep and a tax portion. This makes it clear the progressive nature of the tax code, initial tax brackets are taxed at the lowest amounts and as you fill up more tax brackets, the tax rate, and the amount of money you must give to the government, increases.
As seen with the marginal rates graph, there is a big difference in how regular income and capital gains are taxed. Capital gains are taxed at a lower rate and generally have larger bracket sizes. Generally, wealthier households earn a greater fraction of their income from capital gains and as a result of the lower tax rates on capital gains, these household pay a lower effective tax rate than those making an order of magnitude less in overall income.
Also shown is a summary bar graph that shows the split in your total income into a part that you keep and the other that owed to taxes, i.e. your average tax rate.
How Do Tax Brackets Work
This is a written description of how to apply marginal tax rates. The income you have is split across various tax brackets, which by analogy can be thought of as buckets where once you fill one up, the additional money goes into another bucket, until that is filled up and so on until all your income is distributed across these brackets. The last brackets are open-ended so they are of infinite size.
You start with your deductions which changes based on your filing status, age and if you have itemized deductions. You fill this up first and you can think of this as the 0% tax bracket. Then any additional income goes into the 10% bracket where 10% of this income goes to taxes. This proceeds then onto the 12%, 22% and so on brackets.
The default example is described here for tax year 2025
- If you are single, your standard deduction is $15,750 and you pay no taxes on this money. After that, all of your regular taxable income up to $11,925 is taxed at a 10% rate. This means that your all of your gross income below $15,750 is not taxed and your gross income between $15,750 and $27,675 is taxed at 10%.
- If you have more income, you move up a marginal tax bracket. The next $36,550 in additional taxable income will be taxed at the 12% rate. It is important to note that not all of your income is taxed at the marginal rate, just the income in this bracket these amounts.
- The next $48,900 is taxed at 22% and so on until you have income over $500,000 and are in the 37% marginal tax rate . . . In the default case, you only have $3,775 instead of $48,900 so this portion is taxed at 22%.
- Thus, different parts of your income are taxed at different rates. If you have additional income that puts you into a higher tax bracket, that only affects the added income. This is the approach you would use to calculate an average or effective rate (which is shown in the summary table).
- Capital gains income complicates things slightly as it is taxed after regular income. Thus any amount of capital gains taxes you make are taxed at a rate that corresponds to starting after you regular income. If you made $100,000 in regular income, and only $100 in capital gains income, that $100 dollars would be taxed at the 15% rate and not at the 0% rate, because the $100,000 in regular income pushes you into the 2nd marginal tax bracket for capital gains (between $48,350 and $533,400).
- if the 0% capital gains rate threshold is at $48,350, then any regular income you have will take away from this 0% bracket size. If you have $48,000 in regular taxable income after your deduction, then you will be left with only $350 in 0% capital gains bracket space and the remainder of your capital gains will be taxed in the next bracket, 15%.
Tax Brackets By Year
This table lets you choose to view the thresholds for each income and capital gains tax bracket for the last few years. You can see that tax rates are much lower for capital gains in the table below than for regular income.
Data and Tools:
Tax brackets and rates were obtained from the IRS website and calculations were made using javascript, CSS and HTML. The sankey graph was made using code modified from the Sankeymatic plotting website and the mekko graph was made using the Plotly javascript open source library.
No Comments »