What are the main sources of California’s electricity?
I added the option to view the graph for any day or monthly average from April 2018 to the present using the calendar picker and a daily generation summary
In the United States, electric power plant emissions account for about 25% of greenhouse gas emissions. However, California has been a leader in the transition to clean and renewable energy, driven by ambitious climate policies and a commitment to reducing greenhouse gas emissions. The state has set an electricity target for the state of 60% renewables by 2030 and 100% zero-carbon, clean electricity by 2045. To meet these targets, the state has been investing heavily into solar and wind energy sources. Solar is the largest proportion of California’s electricity grid and California now generates more solar energy than any other state.
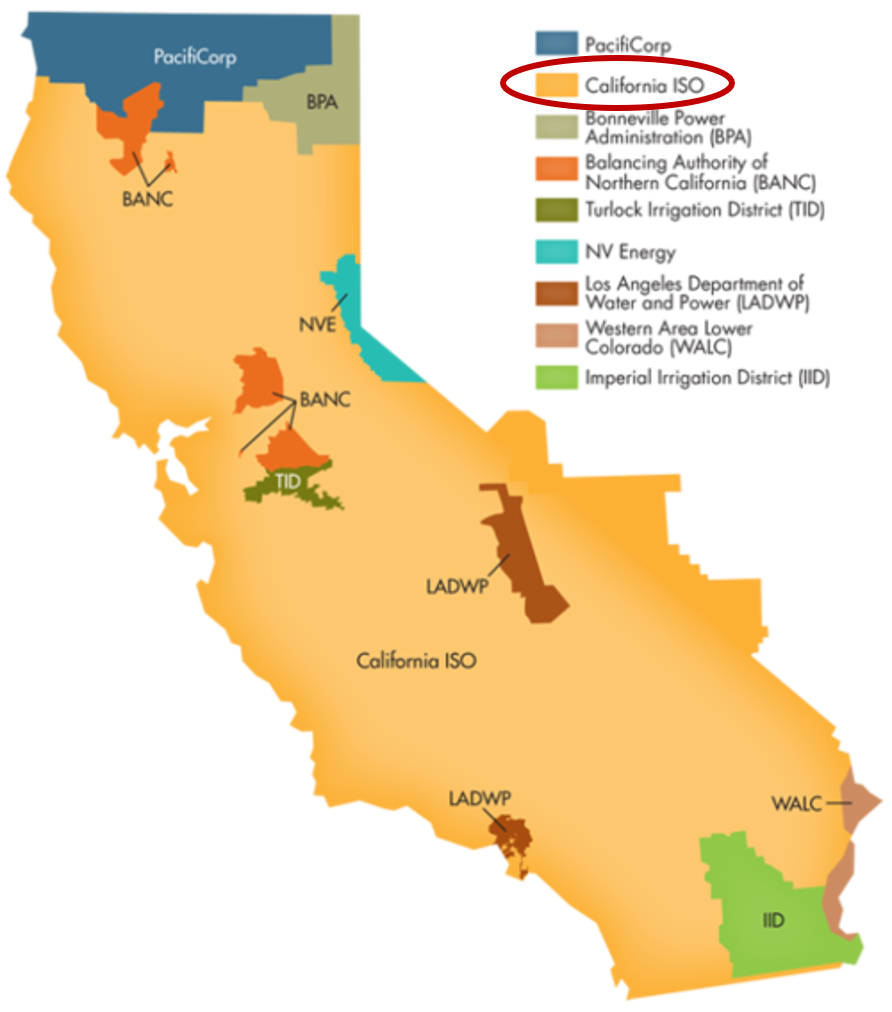
The California Independent System Operator manages the grid for around 32 million Californians or about 80% of the total demand in the state. Here is a map showing the service area and the other electricity districts in the state, the main exceptions include the city of LA and the Sacramento area.
How to read the graph of California’s electricity
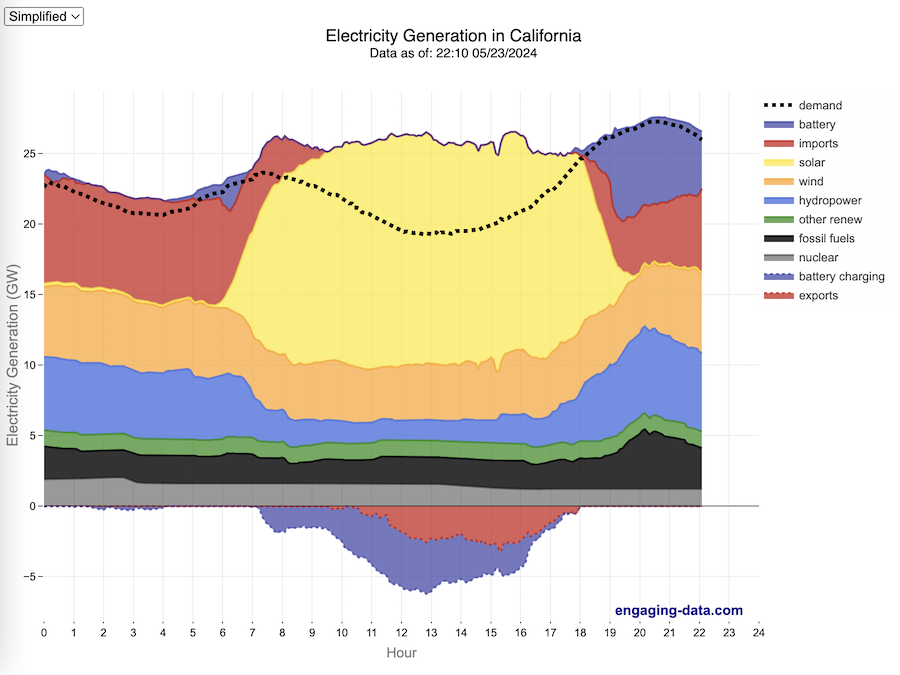
The graphs shown here allow us to visualize how electricity generation in the California Independent System Operator (CAISO) region varies over the course of the day. We can see how solar ramps up to be a huge contributor in the middle of the day. And overall, the vast majority of the generation in the state is one form of renewable electricity or another (e.g. solar, wind, hydro, geothermal, biomass and biogas). Add in a small contribution from zero-carbon nuclear energy and we can see that a large majority of power generation comes from zero-carbon sources. It also shows the total electricity demand, which should always be less than the total electricity supply in the state.
Because of the intermittent nature of some renewables, like wind and solar, there are times where the demand for electricity is not able to be met by these sources, and other options are needed to maintain supply demand balance on the state’s grid. To address this issue, the state relies on importing power from outside of the state as well as energy storage (primarily batteries) to meet electricity demand when renewable energy supply is low. If demand is much less than supply, then likely there will be power exported or some charging of batteries. And if demand is less than total generation in the state, power will be imported and/or batteries will be discharged to make up for the power shortfall.
On the graph, positive values from batteries and imports is when those sources are supplying power to the California grid. Negative values for batteries and exports are when there is excess power in the state and batteries are being charged up or power is being exported to neighboring states.
You can view the graph in two forms:
- Detailed – shows all of the power plant fuel types that is provided in the CAISO data: Solar, Wind, Nuclear, Coal, Other, Natural Gas, Large Hydropower, Small Hydropower, Geothermal, Biomass and Biogas. In addition, it shows aggregated net imports into the state from other regions as well as battery discharging or charging.
- Simplified – I aggregated the categories from CAISO into Solar, Wind, Nuclear, Fossil Fuel (including Coal, Other and Natural Gas), Hydro (Large and Small Hydropower), and Other Renewable (Geothermal, Biomass and Biogas). In addition, it shows aggregated net imports into the state from other regions as well as battery discharging or charging.
Also, I added the ability to see yesterday’s data as well. In the future, I will add the ability to see other dates as well.
Data Sources and Tools
Data for electricity sources for California grid comes from the California Independent System Operator (CAISO). This data from this site is downloaded and processed using a python script and updated every 5 minutes. The graph is made using the open source Plotly javascript graphing library.

4 Comments »
4 Responses to California Electricity Generation
Very interesting, can you show annual aggregates? Thanks
The graphs of electricity sources (and demand) are profoundly informative. Thank you for this excellent work.
Questions:
1. Would it be possible to archive the daily data so that it might be visualized for any given day?
2. What percentage of total California electricity consumption is reflected in the graph. If I understand correctly (and I may well not), this data is from the CAISO which doesn’t include Los Angeles and its environs (but again, I could be wrong)
Again, beautifully done.
Thank you!
Yes, I will be adding a way to pull up the data and graphs for different days.
And yes, CAISO accounts for about 32 million customers or ~80% of the state’s electricity demand, excluding areas like the Los Angeles Dept of Water and Power (LADWP), Sacramento Municipal Utility District (SMUD), and Imperial Irrigation District (IID), among others. I added a map so you can see the areas covered by the CAISO data/graph.
super cool!