How is your income distributed across tax brackets?
This updated visualization is a detailed look at the breakdown how taxes are applied to your income across each of the tax brackets. The previous version of this visualization was a Sankey graph and this new version combines the sankey view with a mekko (or marimekko) graph view. It should help you to better understand marginal and average tax rates. This tool only looks at US Federal Income taxes and ignores state, local and Social Security/Medicare taxes.
**Click Here to view other financial-related tools and data visualizations from engaging-data**
Instructions for using the visual tax calculator:
- Tax Year: Select year from list of years as bracket sizes and deduction changes by year
- Select filing status: Single, Married Filing Jointly or Head of Household. For more info on these filing categories see the IRS website
- Senior checkbox Seniors are eligible for additional standard deduction and from 2025-2028 eligible for additional deduction even if you itemize
- Enter your regular income and capital gains income. Regular income is wage or employment income and is taxed at a higher rate than capital gains income. Capital gains income is typically investment income from the sale of stocks or dividends and taxed at a lower rate than regular income.
- Move your cursor or click on the Sankey graph to select a specific link. This will give you more information about how income in a specific tax bracket is being taxed.
- Itemized deduction Enter the amount of itemized deductions you have including: state and local (property) taxes, mortgage interest, charitable contributions and medical expenses above 7.5% of your AGI
- Share URL Click on the share button to generate a custom URL that will share a graph with your specific numbers in it. The link is copied to your clipboard and placed into the URL bar.
Interpreting the tax visualization graphs
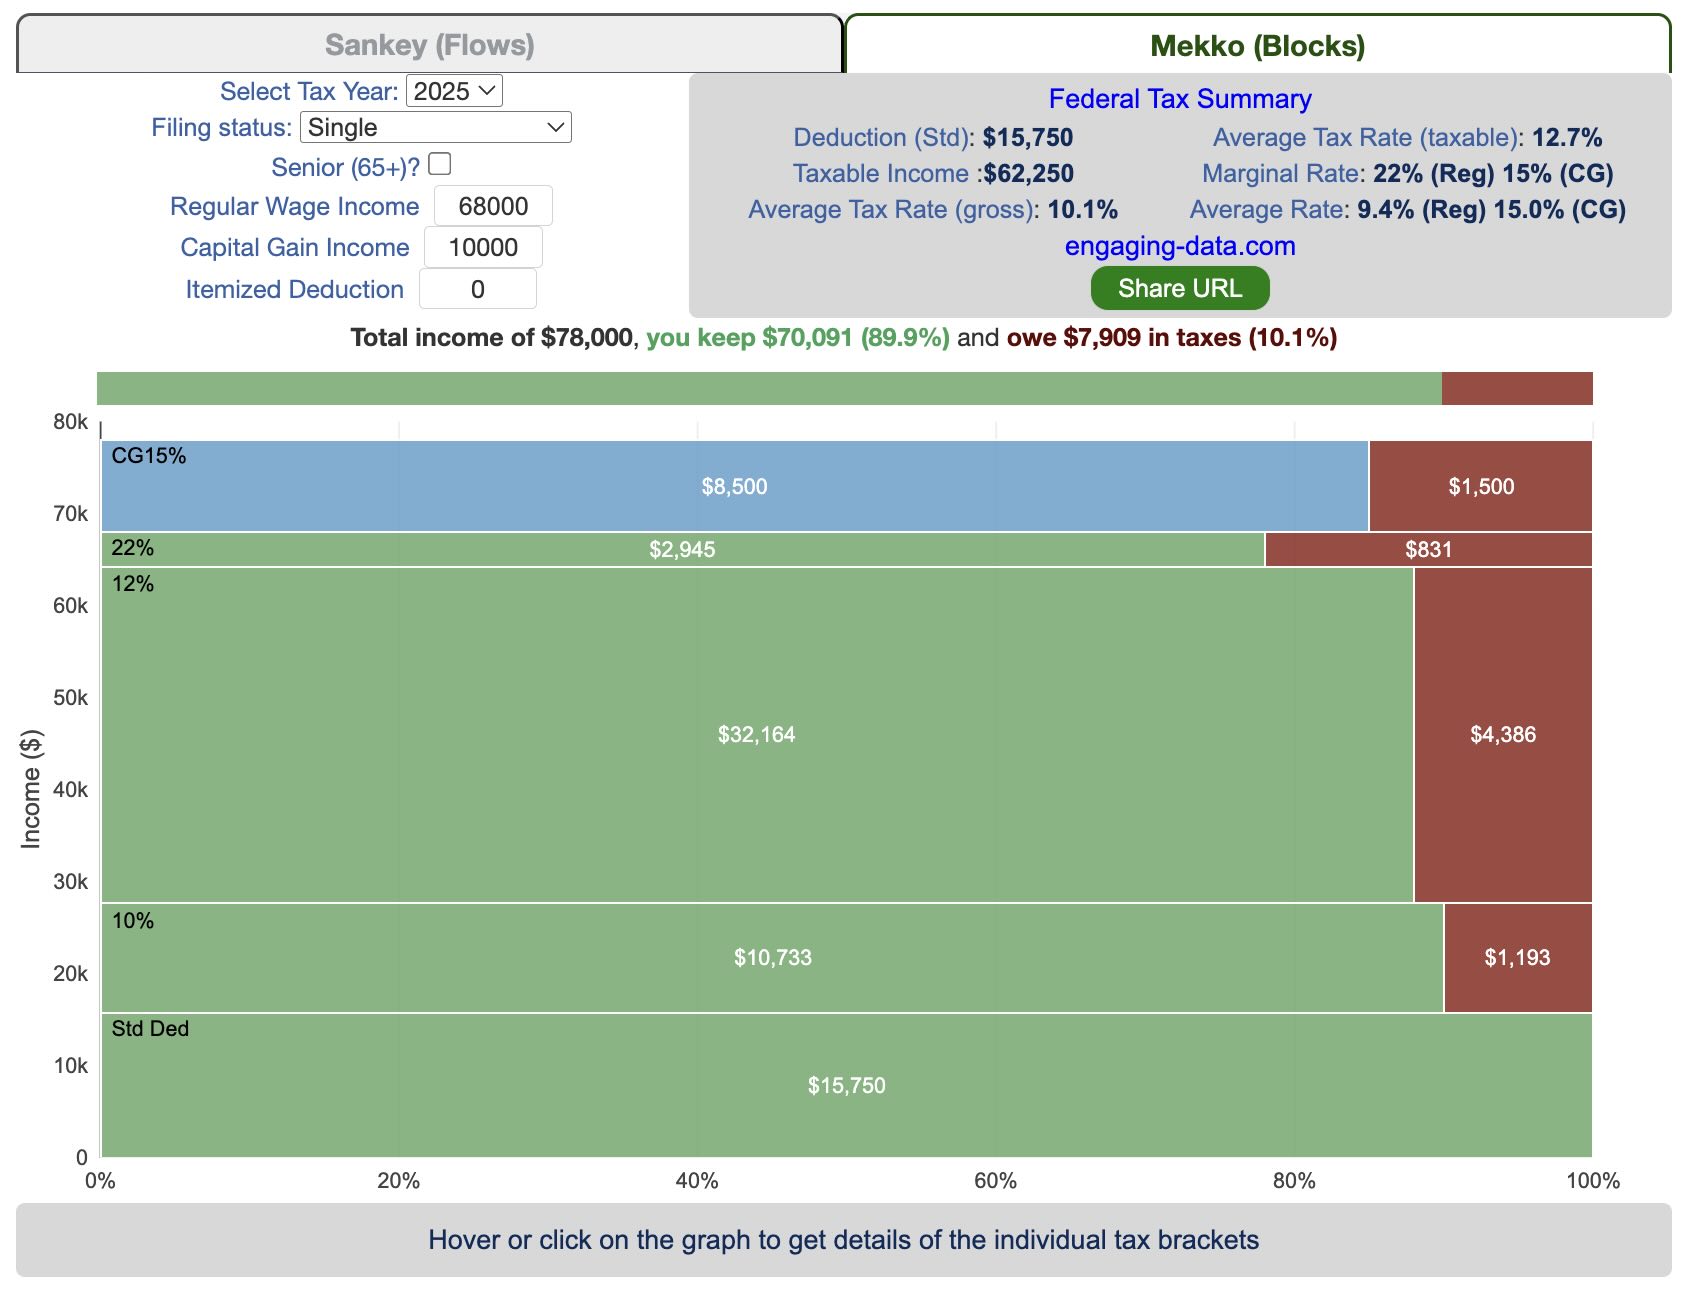
Both the sankey and mekko graphs help you easily the size each of these tax brackets and the fraction of income in that bracket that you can keep and the fraction going to taxes. Also shown is the split of the regular income vs capital gains and how capital gains is “stacked” on top of the regular income.
The mekko graph is a stacked horizontal bar graph where the height of each bar is proportional to the size of the tax bracket and the bar is split into two parts: a keep and a tax portion. This makes it clear the progressive nature of the tax code, initial tax brackets are taxed at the lowest amounts and as you fill up more tax brackets, the tax rate, and the amount of money you must give to the government, increases.
As seen with the marginal rates graph, there is a big difference in how regular income and capital gains are taxed. Capital gains are taxed at a lower rate and generally have larger bracket sizes. Generally, wealthier households earn a greater fraction of their income from capital gains and as a result of the lower tax rates on capital gains, these household pay a lower effective tax rate than those making an order of magnitude less in overall income.
Also shown is a summary bar graph that shows the split in your total income into a part that you keep and the other that owed to taxes, i.e. your average tax rate.
How Do Tax Brackets Work
This is a written description of how to apply marginal tax rates. The income you have is split across various tax brackets, which by analogy can be thought of as buckets where once you fill one up, the additional money goes into another bucket, until that is filled up and so on until all your income is distributed across these brackets. The last brackets are open-ended so they are of infinite size.
You start with your deductions which changes based on your filing status, age and if you have itemized deductions. You fill this up first and you can think of this as the 0% tax bracket. Then any additional income goes into the 10% bracket where 10% of this income goes to taxes. This proceeds then onto the 12%, 22% and so on brackets.
The default example is described here for tax year 2025
- If you are single, your standard deduction is $15,750 and you pay no taxes on this money. After that, all of your regular taxable income up to $11,925 is taxed at a 10% rate. This means that your all of your gross income below $15,750 is not taxed and your gross income between $15,750 and $27,675 is taxed at 10%.
- If you have more income, you move up a marginal tax bracket. The next $36,550 in additional taxable income will be taxed at the 12% rate. It is important to note that not all of your income is taxed at the marginal rate, just the income in this bracket these amounts.
- The next $48,900 is taxed at 22% and so on until you have income over $500,000 and are in the 37% marginal tax rate . . . In the default case, you only have $3,775 instead of $48,900 so this portion is taxed at 22%.
- Thus, different parts of your income are taxed at different rates. If you have additional income that puts you into a higher tax bracket, that only affects the added income. This is the approach you would use to calculate an average or effective rate (which is shown in the summary table).
- Capital gains income complicates things slightly as it is taxed after regular income. Thus any amount of capital gains taxes you make are taxed at a rate that corresponds to starting after you regular income. If you made $100,000 in regular income, and only $100 in capital gains income, that $100 dollars would be taxed at the 15% rate and not at the 0% rate, because the $100,000 in regular income pushes you into the 2nd marginal tax bracket for capital gains (between $48,350 and $533,400).
- if the 0% capital gains rate threshold is at $48,350, then any regular income you have will take away from this 0% bracket size. If you have $48,000 in regular taxable income after your deduction, then you will be left with only $350 in 0% capital gains bracket space and the remainder of your capital gains will be taxed in the next bracket, 15%.
Tax Brackets By Year
This table lets you choose to view the thresholds for each income and capital gains tax bracket for the last few years. You can see that tax rates are much lower for capital gains in the table below than for regular income.
Data and Tools:
Tax brackets and rates were obtained from the IRS website and calculations were made using javascript, CSS and HTML. The sankey graph was made using code modified from the Sankeymatic plotting website and the mekko graph was made using the Plotly javascript open source library.
Related Posts
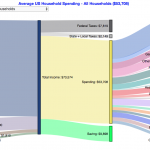 How do Americans Spend Money? US Household Spending Breakdown by Income Group
 Understanding Tax Brackets: Interactive Income Tax Visualization and Calculator
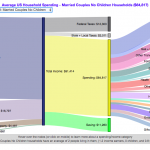 How do Americans Spend Money? US Household Spending Breakdown by Household Composition
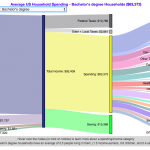 How do Americans Spend Money? US Household Spending Breakdown by Education Level
46 Comments »
46 Responses to Tax Brackets v2.0: Interactive Income Tax Visualization and Calculator
This is such a great tool; looking forward to it being updated for 2026 tax planning… Love this page so much.
This is great! I did notice that the new 65+ deduction is incorrect for the spouse ($4,600 vs $6,000)
Hi- I love this tool! But where do qualified dividends fit in? They are not capital gains but are taxed at the 15% capital gains rate. Should they be considered capital gains as far as the tool is concerned?
yes, they would be added in with long term capital gains, since they are taxed the same.
Awesome! Tks for updating the graph to 2.0 and updating the deductions amounts. You are a graphing genius and this one helps drive my tax situation in simple terms.
^ ^ 1000% ^ ^
I second your comments….. Amazing work and thank you for the updates!
Do you have any plans to incorporate the new elder standard deductions that were passed in the OBBB into this great tax illustration?
FYI…. Effective immediately the 2025 standard deduction has increased to $15,750 for a single and $31,500 for MFJ.
Excellent, updated for 2025 updated… Tks Chris!
Chris – I know I am speaking for others when I say I am looking forward to the 2025 update! This is my favorite tax calculator! Happy New Year!
You need an input field for tax credits. My effective rate after $6500 in credits (4 kids) is 11.8 %. Your calculator shows Average Rate: 14.3% (Reg)
I love your graph, and use it every year for preliminary tax planning. A checkbox (or whatever) to increase the standard deduction for seniors would be extremely useful
I believe those over 65 years of age have a somewhat higher standard deduction amount. How is that factored into your tax bracket model?
Thanks for incorporating the senior deduction!
Wow, what a helpful resource. THANK YOU!!!!!!
By far the best tool I have found for visualizing how income is distrubuted across the various tax brackets. Thanks so much for making this tool available.
Is this calculator still accurate for 2023 and 2024 years?
Thank you so much! You just saved our marriage!
Chris – first, I wanted to thank you. You’re amazing. I have NEVER understood how LTCG brackets work until now!! I also didn’t understand the interaction between the standard deduction and all other income. Tax might as well be Greek to me.
Like others, I’d also suggest including NIIT in the calculation — but I guess the reason you don’t do it is it may not always be triggered depending upon MAGI threshold, etc., so maybe it could be done a little more simply by adding a “checkbox” that adds the 3.8% to the LTCG to be checked “if NIIT applies to your LTCG”? It would just be helpful for those of us who are always adding another 3.8% ….
Lastly, I am HOH and when I “generate a link” it defaults to “single” … just thought you should know that too.
But again, thank you for all you do to help us who need to SEE things to understand them! You’re a lifesaver.
This is the best tax visualization out there to run out any scenarios you have for tax planning. I have used it monthly for a year now to self-manage my taxes and avoid have to constantly update a tax accountant. I hope you keep it going in the future with updated tax tables. If possible it would be great to add the NII tax part. Great work Chris!
I itemize versus taking the standard deduction. If I take my income and split it into preferred tax rates such as LTCP and the remainder to be taxed at ordinary income, delete from the ordinary income total the amount my itemized deductions exceed the standard deduction should that give me the correct taxes?
This is great. It’d be good to have Social Security included as well, since how much of it is taxed and the rate at which it’s taxed depends on other income.
If possible, including other income sources such as Roth accounts would be helpful.
I’m trying to figure out the best way to generate income in retirement, from different sources including a 401k or 403b, a brokerage account, Social Security (when to start?), and a Roth.
Very nice tool, thanks for doing this. Would be appreciated if you also added Social Security income as an input (since calculating the amount of SS that is taxed is a non-trivial exercise).
Hi there, I would love it if you update with the 2023 tax brackets. I use this page a lot for my personal retirement planning. The visual illustration of how your income is taxed has been very helpful for me. Thank you very much for creating this page and sharing it with the rest of us.
Thanks for your comments and I’ve updated it for 2023 tax brackets.
Thanks for the update. This is my favorite tax visualization tool.
One small issue: the result of using the “generate URL” button always defaults to the 2022 year. Can it be changed to specify the year as selected in the Tax Year drop down?
I just added the year to the URL so it should now show the correct year.
As posted several times this really needs the NIIT 3.8% tax added as well above $250,000.
.
.
.
Seems to be missing Net Investment Income (3.8% tax on high capital gains.)
Great tool. Would love to see the option to enter our own deduction value.
I’m not sure if I’m understanding this. From the IRS website, it sounds like only the upper brackets differ for different filing statuses (married vs single). however the first 80k is taxed at 0%, independent of the filing status. However your calculations seem to assume that this is 40k for those who file single (agreeing with everything else I’m finding, aside from the IRS page). What am I misunderstanding from the following sentence from the IRS?
Source, https://www.irs.gov/taxtopics/tc409:
“A capital gain rate of 15% applies if your taxable income is $80,000 or more but less than $441,450 for single; $496,600 for married filing jointly or qualifying widow(er); $469,050 for head of household, or $248,300 for married filing separately.”
Hi Chris
I love this tool! Would you consider adding in dependents? I can do the math myself, but the visualization would be cool with that function!
This is great! Would love to see the state taxes in the visualization as well!
Minor correction: The standard deduction for single filers in 2021 is off by $50. Should be $12,550 (noticed when I got different results from my own spreadsheet).
Thanks for the excellent free tools!
I’ve been mentally visualizing this for a while and wanted to create my own tool, but finally found this one. Thanks, it’s basically perfect for sharing with friends to clarify the concepts.
It might save a few accidents when using this for rough pre-planning by explicitly labeling “LT capital gains”. Spinner arrows (and another field for amount to in/decrement by, e.g., 100, 1000) on the regular and LT CG income text fields would also be particularly handy in demonstrating what-if scenarios.
I think this calculator is great. If the NII tax was added in, that would make it truly exceptional.
This is a really great tool and I used it with my teenage son to show how tax brackets work and how salary vs CG affects things.
As someone already pointed out, I think it’s missing NIIT
This is a super helpful tool. I noticed that the 32% tax bracket is missing for single filers for 2021. Thanks!
Thanks Paige, I had a typo in the tax thresholds. Thanks for catching it. It should be fixed now.
This is fantastic, a great use of the Sankey!
Visualizing the data and impact is an amazing way to convey the message. Appreciate all the tools and insights.
I really like this tool as a way to visualize income & capital gains taxes. I also appreciate that you seem to keep updating it with each new year’s tax brackets.
One thing I did however notice is that it doesn’t account for the 3.8% Medicare Surtax (NIIT) applied when net investment income (MAGI) is over $200,000 for single and $250,000 for married filing jointly. This in effect creates four capital gains tax rates/brackets (0%, 15%, 18.8%, and 23.8%). Kitces.com has a great article talking about harvesting capital gains vs roth conversions where he outlines the various brackets in more detail.
While maybe technically considered a Medicare Tax instead of an Income Tax, it would be nice to be able to toggle weather or not the snakey graph included it or not.
Kitces article mentioned above:
https://www.kitces.com/blog/navigating-income-harvesting-strategies-harvesting-0-capital-gains-vs-partial-roth-conversions/
Great Tool. One comment. I can’t see that it calculated the Net Investment Income Tax for higher level incomes. I know that does complicate things a little, but it would be a nice feature to add. Thanks!
Maybe I’m just dense but where are interest and dividends reported and is Soc. Security just part of wages (taxable portion)?
Minor correction: The qualified dividend / long-term capital gain tax brackets were decoupled from the ordinary income tax brackets in the TCJA. The QD/LTCG 15% tax bracket starts at $38,600 / $77,200 in 2018, not the same $38,700 / $77,400 that marks the 22% marginal rate on ordinary income.