Posts for Tag: graphics
Estimating pi (π) using Monte Carlo Simulation
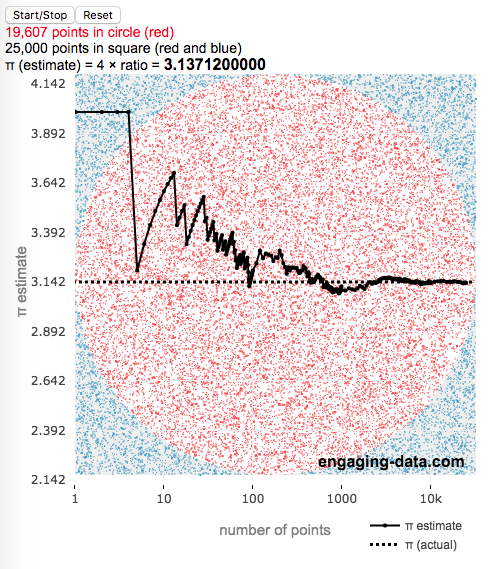
This interactive simulation estimates the value of the fundamental constant, pi (π), by drawing lots of random points to estimate the relative areas of a square and an inscribed circle.
Pi, (π), is used in a number of math equations related to circles, including calculating the area, circumference, etc. and is widely used in geometry, trigonometry and physics.
This app estimates the value of pi by comparing the area of a square and an inscribed circle. The areas are calculated by randomly placing dots into the square and then counting how many of them are also inside the circle. If you do this enough times, you will get a rough ratio of the relative areas of the two shapes. These points are plotted on the graph (red if the fall inside the circle and blue if the fall outside).
Also shown on the graph is the value of our estimate of pi as the simulation progresses, from a few points to many thousands, to millions of points. We can see that when we have only a few points, the value may not be very accurate but as the number of points increases the value of our estimate gets closer to the true value. Running the simulation will add and plot 1 million points. After the first 100 points are added, the rate at which points are added increases. You’ll notice this as the speed at which dots fills up the square increases and because the plot is shown with a logarithmic x-axis.
Here is the math:
Length of side of square: $2 \times r$
radius of circle: $r$
Area of square: $A_{square} = 4r^2$
Area of circle: $A_{circle} = \pi r^2$
The ratio of areas is $A_{circle}/A_{square} = \pi r^2 / 4r^2 = \pi / 4$
Solving for pi: $\pi = 4 \times A_{circle}/A_{square} \approx 4 \times N_{dots_{circle}}/N_{dots_{square}}$
So pi is estimated as 4 times the ratio of dots in the circle vs square
Tools:
This was programmed in javascript, canvas and plotted using the open source plotly javascript plotting library.

Current Bay Area Air Quality
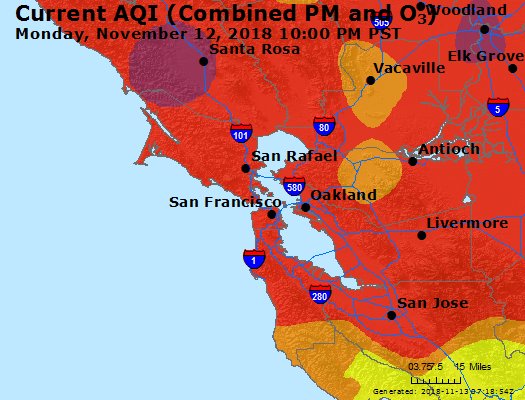
Fires are once again raging in California and air quality in one of the most populated metropolitan areas in the country (the San Francisco Bay Area) is quite poor. This map show current air quality in the Bay Area. For more information see the EPA’s Air Quality website.

AQI colors
EPA has assigned a specific color to each AQI category to make it easier for people to understand quickly whether air pollution is reaching unhealthy levels in their communities. For example, the color orange means that conditions are "unhealthy for sensitive groups," while red means that conditions may be "unhealthy for everyone," and so on.
For more information and additional maps see the EPA’s Air Quality website.
Should You Invest Or Wait When The Stock Market Is At An All-Time-High?
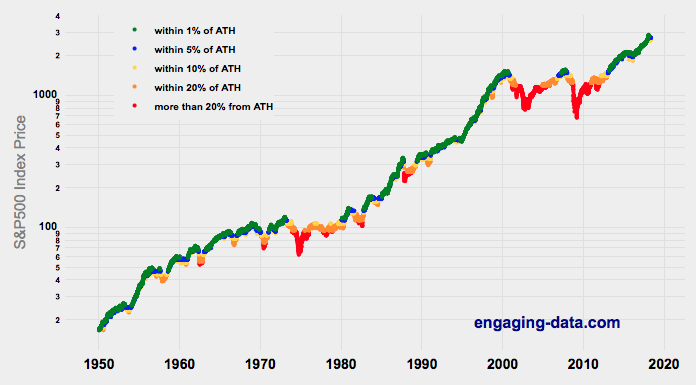
Whenever there’s been an extended bull run, one question that comes to mind “Should I invest in the market now, or wait until a pullback?” The question comes about because of fear and loss aversion: fear that the market will drop right after they invest and the observation that people want to avoid losses more than they value gains. However, historically, the correct answer, at least over the last 70+ years, has been to invest and not to try to time the market.
This was also demonstrated in the Market Timing Game; that people are pretty bad at predicting the direction of the markets and given the upward trend of the market, it’s simpler and more likely than not, better to just stay invested in the market. The corollary to this is that when you have additional money to invest (e.g. from regular savings from your paycheck or a one-time event like the sale of a house), it makes sense to invest the money and not worry about whether the market is at a high or low point. Some graphs that look at the distribution of returns when the market is at an all time high (ATH) can help answer this question of whether you expect to see worse returns than investing at other times.
(more…)
Shall We Play A (Market Timing) Game?
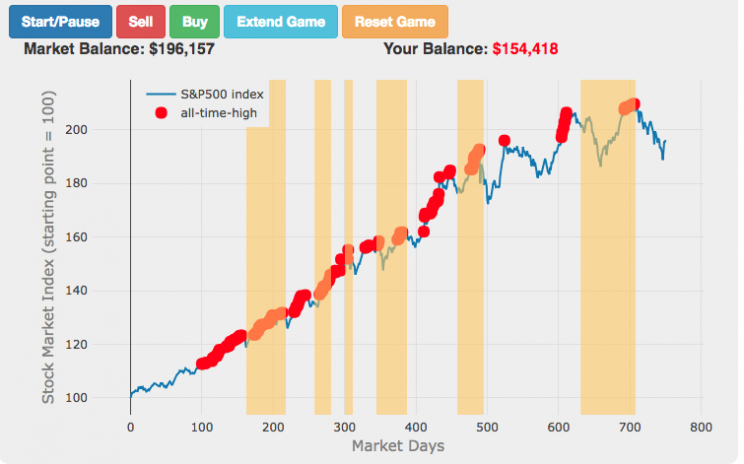

The Market Timing Game simulation is premised on the idea that buying-and-holding index investing and index funds are a no-brainer investment strategy and market timing (i.e. trying to predict market direction and trading accordingly) is a less than optimal strategy. The saying goes “Time in the market not timing the market”. In this simulation, you are given a 3-year market period from sometime in history (data starts January 1, 1950 and goes through the most recent market price, as prices are updated daily) or you can run in Monte Carlo mode (which picks randomly from daily returns in this period) and you start fully invested in the market and can trade out of (and into) the market if you feel like the market will fall (or rise). The goal is to see if you can beat the market index returns.
(more…)
Interactive Dot Illusion (Individual Linear Motion Yields Circular Motion)
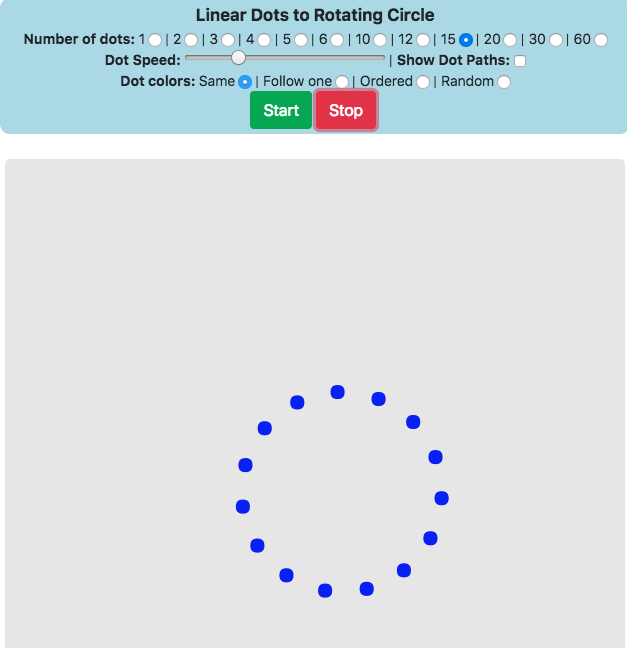
This post doesn’t really involve data, but I was just messing around with animation and the canvas in Javascript and decided to make this. It’s a fun little interactive web animation that makes aggregate circular motion from a bunch of dots moving in straight lines. There are no real instructions except to mess with the controls and see what it does to the animation (i.e. change the number of dots, the speed slider, the dot colors, and show the dot paths).
(more…)
Estimating pi (π) using Monte Carlo Simulation
This interactive simulation estimates the value of the fundamental constant, pi (π), by drawing lots of random points to estimate the relative areas of a square and an inscribed circle.
Pi, (π), is used in a number of math equations related to circles, including calculating the area, circumference, etc. and is widely used in geometry, trigonometry and physics.
This app estimates the value of pi by comparing the area of a square and an inscribed circle. The areas are calculated by randomly placing dots into the square and then counting how many of them are also inside the circle. If you do this enough times, you will get a rough ratio of the relative areas of the two shapes. These points are plotted on the graph (red if the fall inside the circle and blue if the fall outside).
Also shown on the graph is the value of our estimate of pi as the simulation progresses, from a few points to many thousands, to millions of points. We can see that when we have only a few points, the value may not be very accurate but as the number of points increases the value of our estimate gets closer to the true value. Running the simulation will add and plot 1 million points. After the first 100 points are added, the rate at which points are added increases. You’ll notice this as the speed at which dots fills up the square increases and because the plot is shown with a logarithmic x-axis.
Here is the math:
Length of side of square: $2 \times r$
radius of circle: $r$
Area of square: $A_{square} = 4r^2$
Area of circle: $A_{circle} = \pi r^2$
The ratio of areas is $A_{circle}/A_{square} = \pi r^2 / 4r^2 = \pi / 4$
Solving for pi: $\pi = 4 \times A_{circle}/A_{square} \approx 4 \times N_{dots_{circle}}/N_{dots_{square}}$
So pi is estimated as 4 times the ratio of dots in the circle vs square
Tools:
This was programmed in javascript, canvas and plotted using the open source plotly javascript plotting library.
Current Bay Area Air Quality
Fires are once again raging in California and air quality in one of the most populated metropolitan areas in the country (the San Francisco Bay Area) is quite poor. This map show current air quality in the Bay Area. For more information see the EPA’s Air Quality website.
AQI colors
EPA has assigned a specific color to each AQI category to make it easier for people to understand quickly whether air pollution is reaching unhealthy levels in their communities. For example, the color orange means that conditions are "unhealthy for sensitive groups," while red means that conditions may be "unhealthy for everyone," and so on.
For more information and additional maps see the EPA’s Air Quality website.
Should You Invest Or Wait When The Stock Market Is At An All-Time-High?
Whenever there’s been an extended bull run, one question that comes to mind “Should I invest in the market now, or wait until a pullback?” The question comes about because of fear and loss aversion: fear that the market will drop right after they invest and the observation that people want to avoid losses more than they value gains. However, historically, the correct answer, at least over the last 70+ years, has been to invest and not to try to time the market.
This was also demonstrated in the Market Timing Game; that people are pretty bad at predicting the direction of the markets and given the upward trend of the market, it’s simpler and more likely than not, better to just stay invested in the market. The corollary to this is that when you have additional money to invest (e.g. from regular savings from your paycheck or a one-time event like the sale of a house), it makes sense to invest the money and not worry about whether the market is at a high or low point. Some graphs that look at the distribution of returns when the market is at an all time high (ATH) can help answer this question of whether you expect to see worse returns than investing at other times.
(more…)
Shall We Play A (Market Timing) Game?
The Market Timing Game simulation is premised on the idea that buying-and-holding index investing and index funds are a no-brainer investment strategy and market timing (i.e. trying to predict market direction and trading accordingly) is a less than optimal strategy. The saying goes “Time in the market not timing the market”. In this simulation, you are given a 3-year market period from sometime in history (data starts January 1, 1950 and goes through the most recent market price, as prices are updated daily) or you can run in Monte Carlo mode (which picks randomly from daily returns in this period) and you start fully invested in the market and can trade out of (and into) the market if you feel like the market will fall (or rise). The goal is to see if you can beat the market index returns.
(more…)
Interactive Dot Illusion (Individual Linear Motion Yields Circular Motion)
This post doesn’t really involve data, but I was just messing around with animation and the canvas in Javascript and decided to make this. It’s a fun little interactive web animation that makes aggregate circular motion from a bunch of dots moving in straight lines. There are no real instructions except to mess with the controls and see what it does to the animation (i.e. change the number of dots, the speed slider, the dot colors, and show the dot paths).
(more…)
Recent Comments