Posts for Tag: graph
Wordle Stats – How Hard is Today’s Wordle?

Update: Added a histogram below main graph to view the difficulty of today’s puzzle in context of historical data (compared to a number of previous puzzles)
What is today’s Wordle difficulty?
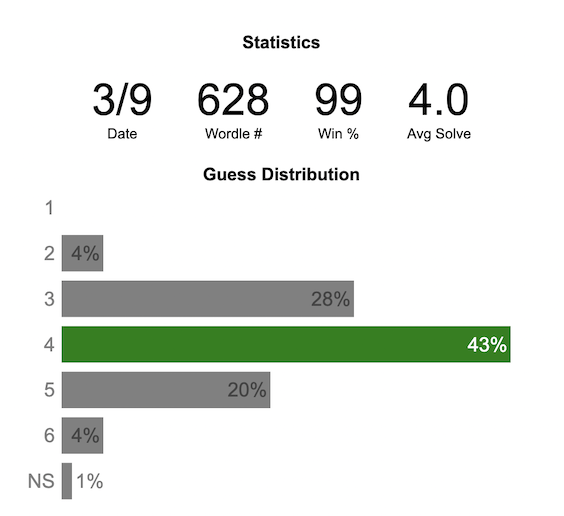
NY Times’ Wordle is a game of highs and lows. Sometimes your guesses are lucky (I mean, highly skilled) and you can solve the puzzle easily and sometimes you barely get it in 6 guesses. When the latter happens, sometimes you want validation that that day’s puzzle was hard. This dataviz lets you see how difficult today’s wordle puzzle was for other NY Times Wordle players did.
The graph shows the distribution of guesses needed to solve today’s Wordle puzzle, rounded to the nearest whole percent. It also colors the most common number of guesses to solve the puzzle in green and calculates the average number of guesses. “NS” stands for Not Solved. The lower histogram provides some context for how difficult the day’s puzzle is compared to many other puzzles in the past based on average number of guesses needed to solve the puzzle. It doesn’t include the entire history of wordle, but a subset of days that I was able to gather data on.
Even over 1 year later, I still enjoy playing Wordle. I even made a few Wordle games myself – Wordguessr – Tridle – Scrabwordle. I’ve been enjoying the Wordlebot which does a daily analysis of your game. I especially enjoy how it indicates how “lucky” your guesses were and how they eliminated possible answers until you arrive at the puzzle solution. One thing it also provides is data on the frequency of guesses that are made which provides information on the number of guesses it took to solve each puzzle.
Instructions
Click on the eye to get the answer to the day’s puzzle.
Select “Hard Mode” from the dropdown menu in order to see the statistics for hard mode
Data and Tools
The data comes from playing NY Times Wordle game and using their Wordlebot. Python is used to extract the data and wrangle the data into a clean format. Visualization was done in javascript and specifically the plotly visualization library.
Colorado River Reservoir Levels
How much water is in the main Colorado River reservoirs?
Check out my California Reservoir Levels Dashboard
I based this graph off of my California Reservoir marimekko graph, because many folks were interested in seeing a similar figure for the Colorado river reservoirs.
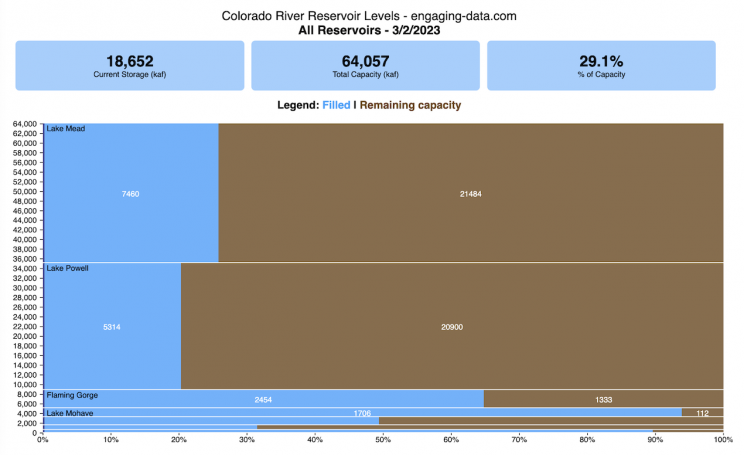
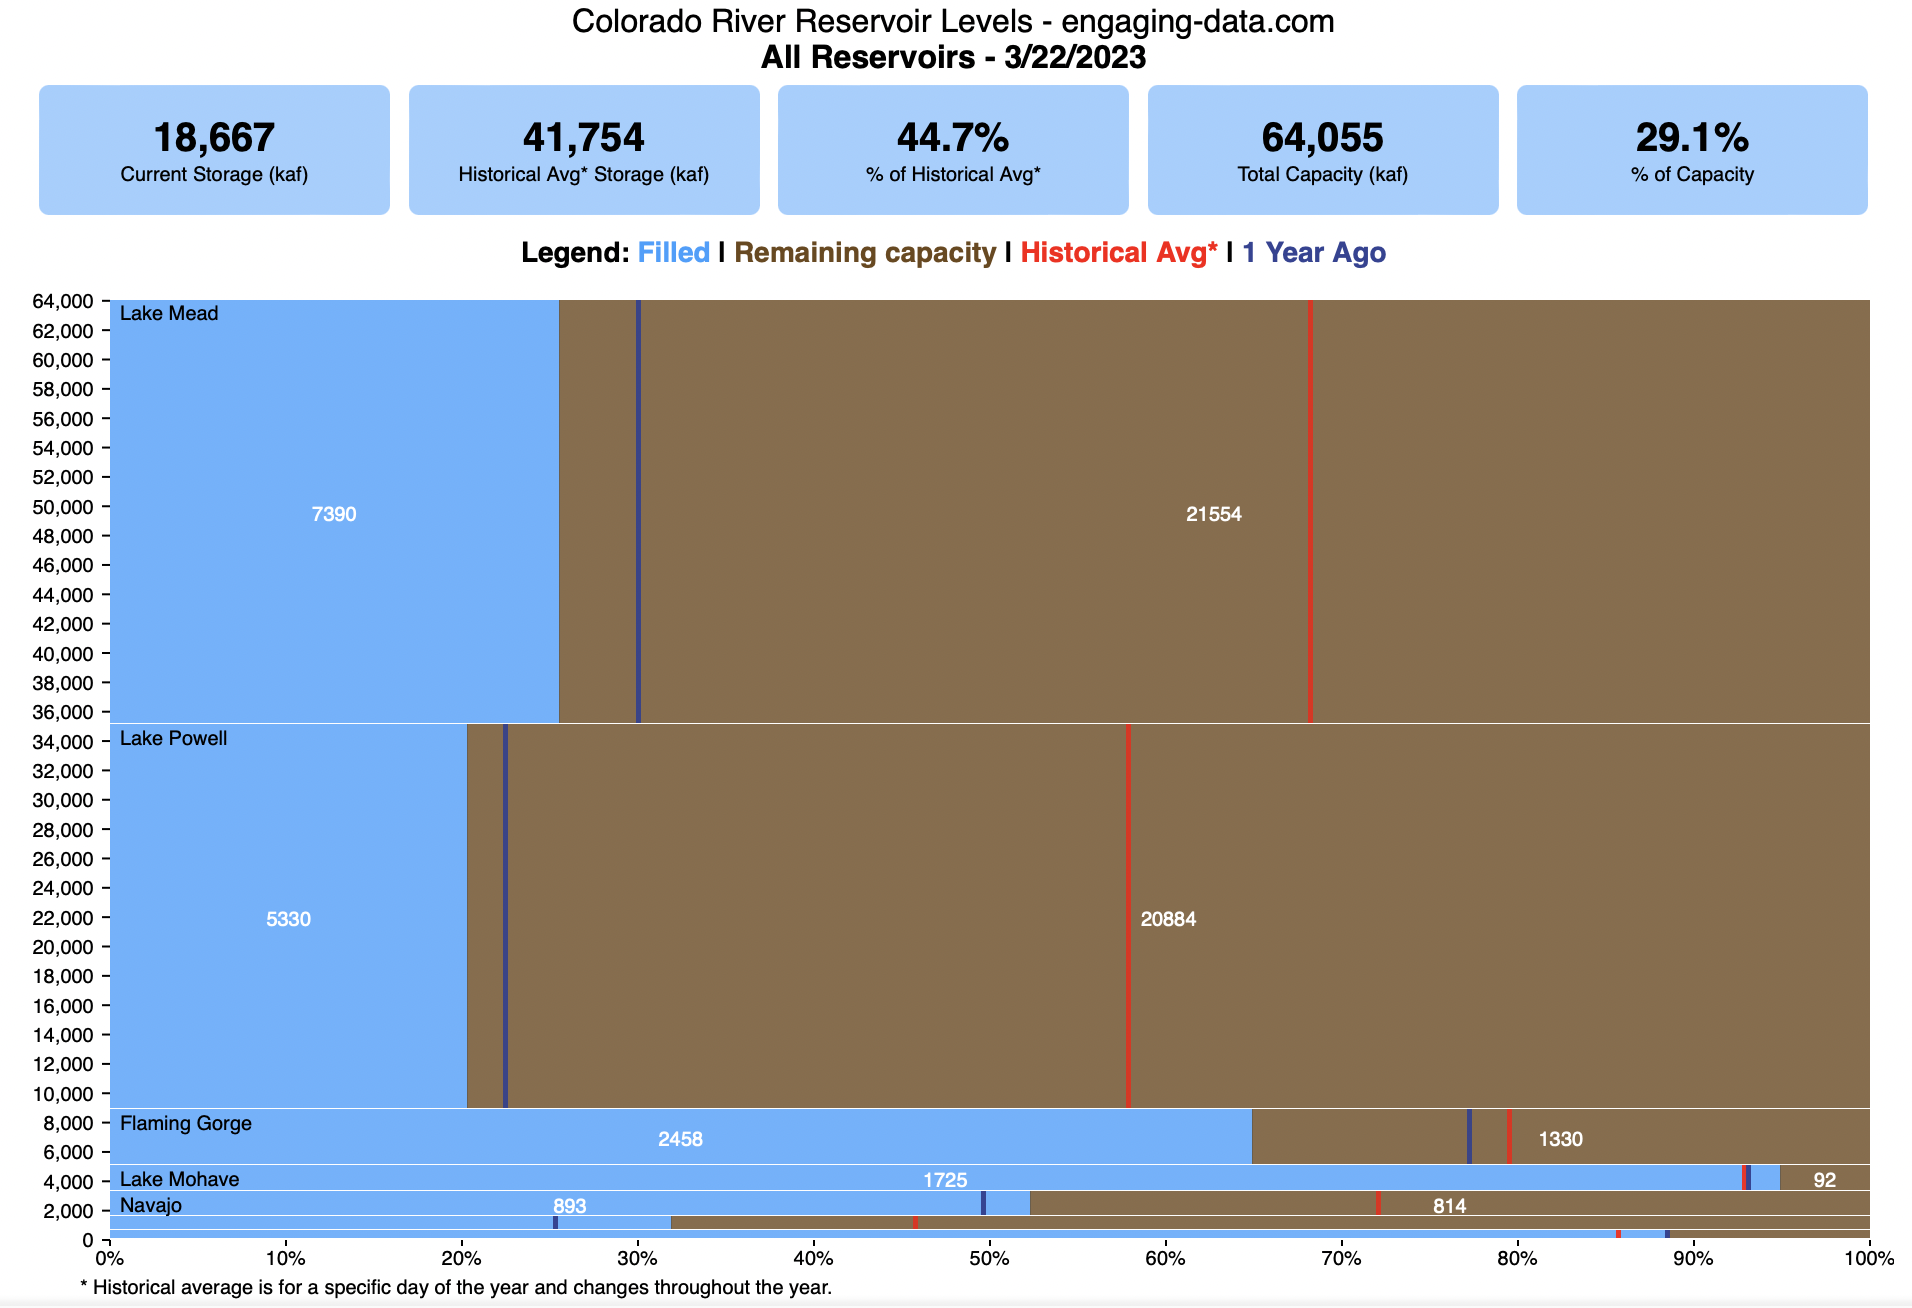
This is a marimekko (or mekko) graph which may take some time to understand if you aren’t used to seeing them. Each “row” represents one reservoir, with bars showing how much of the reservoir is filled (blue) and unfilled (brown). The height of the “row” indicates how much water the reservoir could hold. Lake Mead is the reservoir with the largest capacity (at almost 29,000 kaf) and so it is the tallest row. The proportion of blue to brown will show how full it is. As with the California version of this graph, there are also lines that represent historical levels, including historical median level for the day of the year (in red) and the 1 year ago level, which is shown as a dark blue line. I also added the “Deadpool” level for the two largest reservoirs. This is the level at which water cannot flow past the dam and is stuck in the reservoir.
Lake Mead and Lake Powell are by far the largest of these reservoirs and also included are several smaller reservoirs (relative to these two) so the bars will be very thin to the point where they are barely a sliver or may not even show up.
Historical Data
Historical data comes from https://www.water-data.com/ and differs for each reservoir.
- Lake Mead – 1941 to 2015
- Lake Powell – 1964 to 2015
- Flaming Gorge – 1972 to 2015
- Lake Mohave – 1952 to 2015
- Lake Navajo – 1969 to 2015
- Blue Mesa – 1969 to 2015
- Lake Havasu – 1939 to 2015
The daily data for each reservoir was captured in this time period and median value for each day of the calendar year was calculated and this is shown as the red line on the graph.
Instructions:
If you are on a computer, you can hover your cursor over a reservoir and the dashboard at the top will provide information about that individual reservoir. If you are on a mobile device you can tap the reservoir to get that same info. It’s not possible to see or really interact with the tiniest slivers. The main goal of this visualization is to provide a quick overview of the status of the main reservoirs along the Colorado River (or that provide water to the Colorado).
Units are in kaf, thousands of acre feet. 1 kaf is the amount of water that would cover 1 acre in one thousand feet of water (or 1000 acres in water in 1 foot of water). It is also the amount of water in a cube that is 352 feet per side (about the length of a football field). Lake Mead is very large and could hold about 35 cubic kilometers of water at full (but not flood) capacity.
Data and Tools
The data on water storage comes from the US Bureau of Reclamation’s Lower Colorado River Water Operations website. Historical reservoir levels comes from the water-data.com website. Python is used to extract the data and wrangle the data in to a clean format, using the Pandas data analysis library. Visualization was done in javascript and specifically the D3.js visualization library.
Visualizing California’s Water Storage – Reservoirs and Snowpack
How much water is stored in California’s snowpack and reservoirs?
California’s snow pack is essentially another “reservoir” that is able to store water in the Sierra Nevada mountains. Graphing these things together can give a better picture of the state of California’s water and drought.
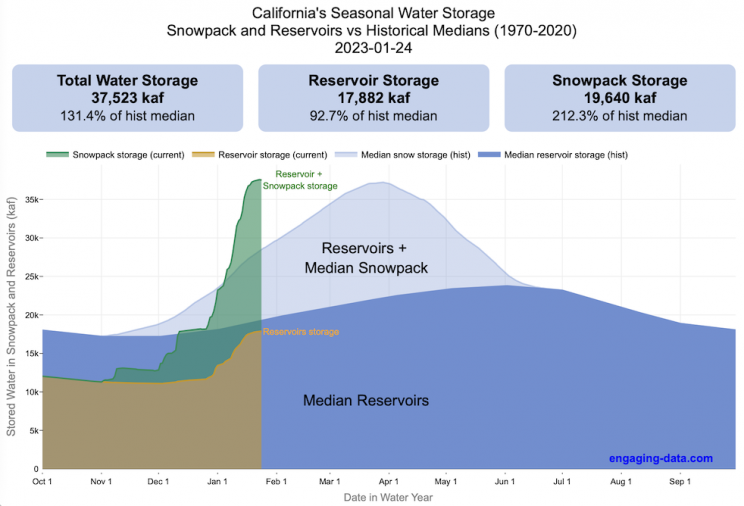
The historical median (i.e. 50th percentile) for snow pack water content is stacked on top of the median for reservoirs storage (shown in two shades of blue). The current water year reservoirs is shown in orange and the current year’s snow pack measurement is stacked on top in green. What is interesting is that the typical peak snow pack (around April 1) holds almost as much water (about 2/3 as much) as the reservoirs typically do. However, the reservoirs can store these volumes for much of the year while the snow pack is very seasonal and only does so for a short period of time.
Snowpack is measured at 125 different snow sensor sites throughout the Sierra Nevada mountains. The reservoir value is the total of 50 of the largest reservoirs in California. In both cases, the median is derived from calculating the median values for each day of the year from historical data from these locations from 1970 to 2021.
I’ve been slowly building out the water tracking visualizations tools/dashboards on this site. And with the recent rains (January 2023), there has been quite a bit of interest in these visualizations. One data visualization that I’ve wanted to create is to combine the precipitation and reservoir data into one overarching figure.
Creating the graph
I recently saw one such figure on Twitter by Mike Dettinger, a researcher who studies water/climate issues. The graph shows the current reservoir and snowpack water content overlaid on the historic levels. It is a great graph that conveys quite a bit of info and I thought I would create an interactive version of these while utilizing the automated data processing that’d I’d already created to make my other graphs/dashboards.
Time for another reservoirs-plus-snowpack storage update….LOT of snow up there now and the big Sierra reservoirs (even Shasta!) are already benefitting. Still mostly below average but moving up. Snow stacking up in UCRB. @CW3E_Scripps @DroughtGov https://t.co/2eZgNArahy pic.twitter.com/YEH4IYKlnH
— Mike Dettinger (@mdettinger) January 15, 2023
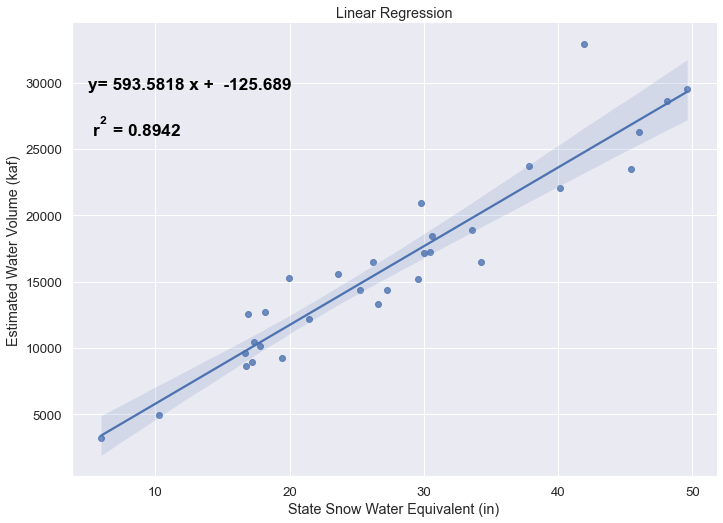
The challenge was to convert inches of snow water equivalent into a total volume of water in the snowpack, which I asked Mike about. He pointed me to a paper by Margulis et al 2016 that estimates the total volume of water in the Sierra snowpack for 31 years. Since I already had downloaded data on historical snow water equivalents for these same years, I could correlate the estimated peak snow water volume (in cubic km) to the inches of water at these 120 or so Sierra snow sensor sites. I ran a linear regression on these 30 data points. This allowed me to estimate a scaling factor that converts the inches of water equivalent to a volume of liquid water (and convert to thousands of acre feet, which is the same unit as reservoirs are measured in).
This scaling factor allows me to then graph the snowpack water volume with the reservoir volumes.
See my snowpack visualization/post to see more about snow water equivalents.
My numbers may differ slightly from the numbers reported on the state’s website. The historical percentiles that I calculated are from 1970 until 2020 while I notice the state’s average is between 1990 and 2020.
You can hover (or click) on the graph to audit the data a little more clearly.
Sources and Tools
Data is downloaded from the California Data Exchange Center website of the California Department of Water Resources using a python script. The data is processed in javascript and visualized here using HTML, CSS and javascript and the open source Plotly javascript graphing library.

California Snowpack Levels Visualization
How does the current California snowpack compare with Historical Averages?
If you are looking at this it’s probably winter in California and hopefully snowy in the mountains. In the winter, snow is one of the primary ways that water is stored in California and is on the same order of magnitude as the amount of water in reservoirs.
When I made this graph of California snowpack levels (Jan 2023) we’ve had quite a bit of rain and snow so far and so I wanted to visualize how this year compares with historical levels for this time of year. This graph will provide a constantly updated way to keep tabs on the water content in the Sierra snowpack.
Snow water content is just what it sounds like. It is an estimate of the water content of the snow. Since snow can have be relatively dry or moist, and can be fluffy or compacted, measuring snow depth is not as accurate as measuring the amount of water in the snow. There are multiple ways of measuring the water content of snow, including pads under the snow that measure the weight of the overlying snow, sensors that use sound waves and weighing snow cores.
I used data for California snow water content totals from the California Department of Water Resources. Other California water-related visualizations include reservoir levels in the state as well.
There are three sets of stations (and a state average) that are tracked in the data and these plots:
- Northern Sierra/Trinity – (32 snow sensors)
- Central Sierra – (57 snow sensors)
- Southern Sierra – (36 snow sensors)
- State-wide average – (125 snow sensors)
Here is a map showing these three regions.
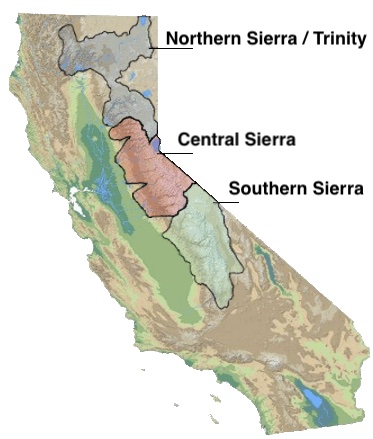
These stations are tracked because they provide important information about the state’s water supply (most of which originates from the Sierra Nevada Mountains). Winter and spring snowpack forms an important reservoir of water storage for the state as this melting snow will eventually flow into the state’s rivers and reservoirs to serve domestic and agricultural water needs.
The visualization consists of a graph that shows the range of historical values for snow water content as a function of the day of the year. This range is split into percentiles of snow, spreading out like a cone from the start of the water year (October 1) ramping up to the peak in April and then converging back to zero in summertime. You can see the current water year plotted on this in red to show how it compares to historical values.
My numbers may differ slightly from the numbers reported on the state’s website. The historical percentiles that I calculated are from 1970 until 2022 while I notice the state’s average is between 1990 and 2020.
You can hover (or click) on the graph to audit the data a little more clearly.
Sources and Tools
Data is downloaded from the California Data Exchange Center website of the California Department of Water Resources using a python script. The data is processed in javascript and visualized here using HTML, CSS and javascript and the open source Plotly javascript graphing library.
US Baby Name Popularity Visualizer

I added a share button (arrow button) that lets you send a graph with specific name. It copies a custom URL to your clipboard which you can paste into a message/tweet/email.
How popular is your name in US history?
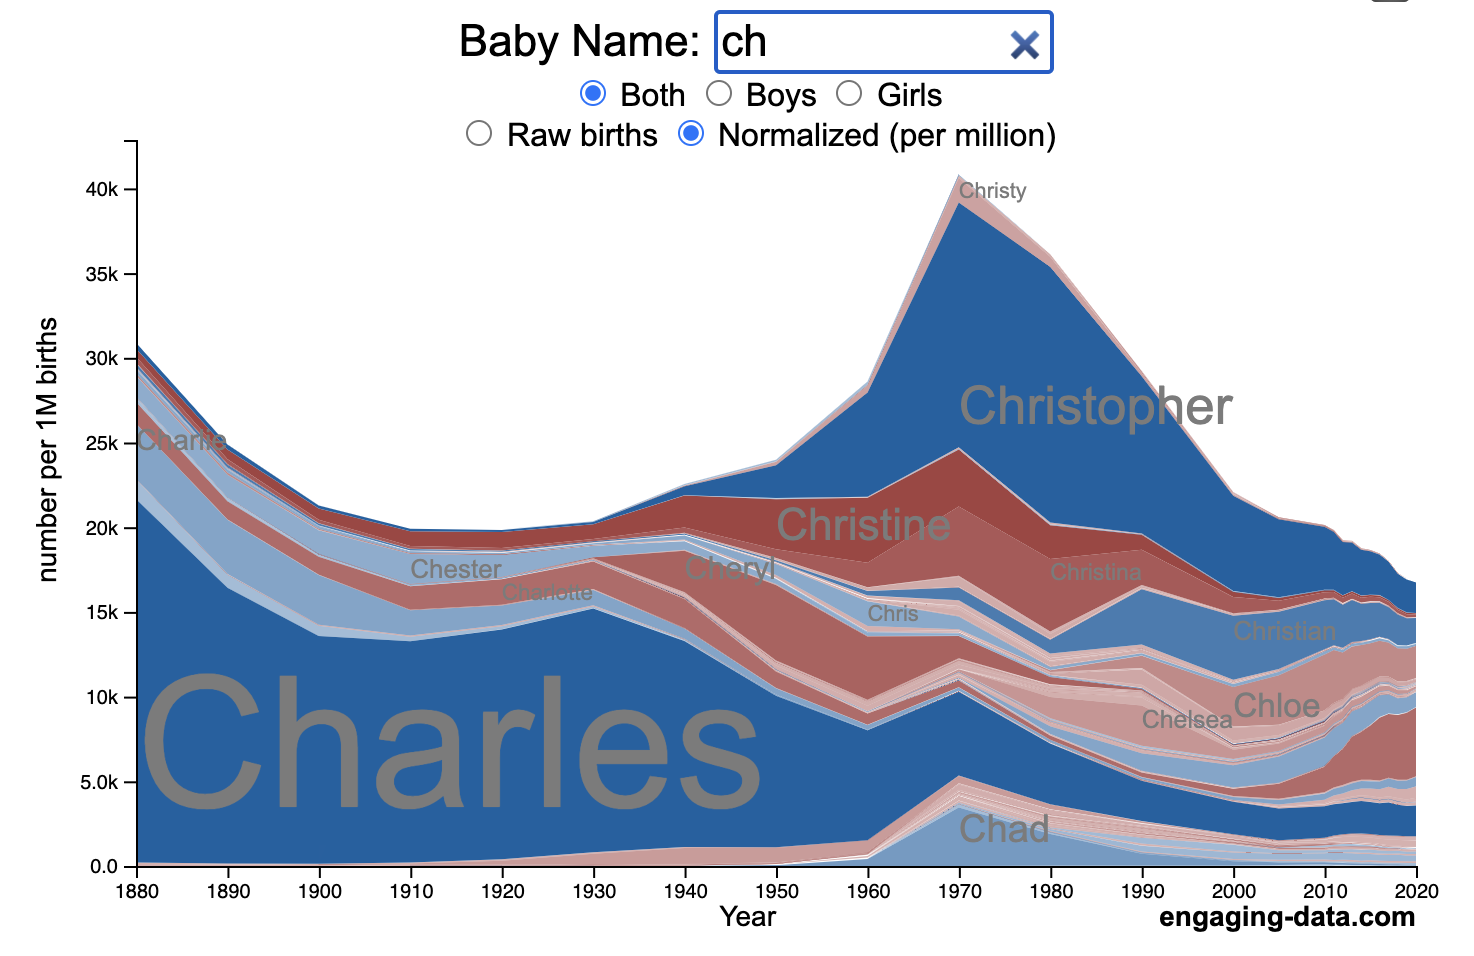
Use this visualization to explore statistics about names, specifically the popularity of different names throughout US history (1880 until 2020). This is a useful tool for seeing the rise (and fall) of popularity of names. Look at names that we think of as old-fashioned, and names that are more modern.
Instructions
- Start typing a name into the input box above and the visualization will show all the names that begin with those letters. The graph will show the historical popularity of all these names as an area graph.
- You can hover (or click on mobile) to bring up a tooltip (popup) that shows you the exact number of births with that name for different years (or decades) and the names rank in that time period.
- It’s best used on computer (rather than a mobile or tablet device) so you can see the graph more clearly and also, if you click on a name wedge, it will zoom into names that begin with those letters.
- You can select different views, Boy names, Girl names or both, as well as looking at the raw number of births or a normalized popularity that accounts for the differential number of births throughout the period between 1880 and 2020.
- If you click the share (arrow) button, it will copy the parameters of the current graph you are looking at and create a custom URL to share with others. It copes the link into your clipboard and your browser’s address (URL) bar.
Isn’t there something out there like this already? Baby Name Wizard and Baby Name Voyager
This visualization is not my original idea, but rather a re-creation of the Baby Name Voyager (from the Baby Name Wizard website) created by Laura Wattenberg. The original visualization disappeared (for some unknown reason) from the web, and I thought it was a shame that we should be deprived of such a fun resource.
It started about a week ago, when I saw on twitter that the Baby Name Wizard website was gone. Here’s the blog post from Laura. I hadn’t used it in probably a decade, but it flashed me back to many years ago well before I got into web programming and dataviz and I remember seeing the Baby Name Voyager and thinking how amazing it was that someone could even make such a thing. Everyone I knew played with it quite a bit when it first came out. It got me thinking that it should still be around and that I could probably make it now with my programming skills and how cool that would be.
So I downloaded the frequency data for Baby Names from the US Social Security Administration and set to work trying to create a stacked area graph of baby names vs time. I started with my go to library for fast dataviz (Plotly.js) but eventually ended up creating the visualization in d3.js which is harder for me, but made it very responsive. I’m not an expert in d3, but know enough that using some similar examples and with lots of googling and stack overflow, I could create what I wanted.
I emailed Laura after creating a sample version, just to make sure it was okay to re-create it as a tribute to the Baby Name Wizard / Voyager and got the okay from her.
Where does the data come from?
Some info about Data (from SSA Baby Names Website):
All names are from Social Security card applications for births that occurred in the United States after 1879. Note that many people born before 1937 never applied for a Social Security card, so their names are not included in our data.
Name data are tabulated from the “First Name” field of the Social Security Card Application. Hyphens and spaces are removed, thus Julie-Anne, Julie Anne, and Julieanne will be counted as a single entry.
Name data are not edited. For example, the sex associated with a name may be incorrect.
Different spellings of similar names are not combined. For example, the names Caitlin, Caitlyn, Kaitlin, Kaitlyn, Kaitlynn, Katelyn, and Katelynn are considered separate names and each has its own rank.
All data are from a 100% sample of our records on Social Security card applications as of March 2021.
I did notice that there was a significant under-representation of male names in the early data (before 1910) relative to female names. In the normalized data, I set the data for each sex to 500,000 male and 500,000 female births per million total births, instead of the actual data which shows approximately double the number of female names than male names. Not sure why females would have higher rates of social security applications in the early 20th century. Update: A helpful Redditor pointed me to this blog post which explains some of the wonkiness of the early data. The gist of it is that Social Security cards and numbers weren’t really a thing until 1935. Thus the names of births in 1880 are actually 55 year olds who applied for Social Security numbers and since they weren’t mandatory, they don’t include everyone. My correction basically makes the assumption that this data is actually a survey and we got uneven samples from males and female respondents. It’s not perfect (like the later data) but it’s a decent representation of name distribution.
Sources and Tools:
The biggest source of inspiration was of course, Laura Wattenberg’s original Baby Name Explorer.
I downloaded the baby names from the Social Security website. Thanks to Michael W. Shackleford at the SSA for starting their name data reporting. I used a python script to parse and organize the historical data into the proper format my javascript. The visualization is created using HTML, CSS and Javascript code (and the d3.js visualization library) to create interactivity and UI. Curran Kelleher’s area label d3 javascript library was a huge help for adding the names to the graph.
Compound Interest and Stock Returns Calculator
Calculate returns on regular, periodic investments
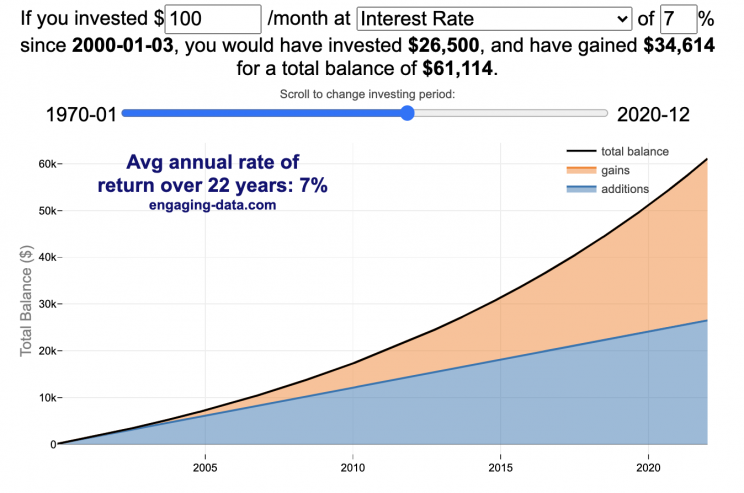
This calculator lets you visualize the value of investing regularly. It lets you calculate the compounding from a simple interest rate or looking at specific returns from the stock market indexes or a few different individual stocks.
Instructions
- Enter the amount of money to be invested monthly
- Choose to use an interest rate (and enter a specific rate) or
- Choose a stock market index or individual stock
- Use the slider to change the initial starting date of your periodic investments – You can go as far back as 1970 or the IPO date of the stock if it is later than that.
- Use the “Generate URL to Share” button to create a special URL with the specific parameters of your choice to share with others – the URL will appear in your browser’s address bar.
You can hover over the graph to see the split between the money you invested and the gains from the investment. In most cases (unless returns are very high), initially the investments are the large majority of the total balance, but over time the gains compound and eventually, it is those gains rather than the initial investments that become the majority of the total.
Some of the tech stocks included in the dropdown list have very high annualized returns and thus the gains quickly overtake the additions as the dominant component of the balance and you can make a great deal of money fairly quickly.
It becomes clearer as you move the slider around, that longer investing time periods are the key to increasing your balance, so building financial prosperity through investing is generally more of a marathon and not really a sprint. However, if you invest in individual stocks and pick a good one, you can speed up that process, though it’s not necessarily the most advisable way to proceed. Lots of people underperform the market (i.e. index funds) or even lose money by trying to pick big winners.
Understanding the Calculations
Calculating compound returns is relatively easy and is just a matter of consecutively multiplying the return. If the return is 7% for 5 years, that is equal to multiplying 1.07 five times, i.e. 1.075 = 1.402 (or a 40.2% gain).
In this case, we are adding additional investments each month but the idea is the same. Take the amount of money (or value of shares) and multiply by the return (>1 if positive or <1 for negative returns) after each period of the analysis.
Sources and Tools:
Stock and index monthly data is downloaded from Yahoo! finance is downloaded regularly using a python script.
The graph is created using the open-source Plotly javascript visualization library, as well as HTML, CSS and Javascript code to create interactivity and UI.

Wordle Stats – How Hard is Today’s Wordle?
Update: Added a histogram below main graph to view the difficulty of today’s puzzle in context of historical data (compared to a number of previous puzzles)
What is today’s Wordle difficulty?
NY Times’ Wordle is a game of highs and lows. Sometimes your guesses are lucky (I mean, highly skilled) and you can solve the puzzle easily and sometimes you barely get it in 6 guesses. When the latter happens, sometimes you want validation that that day’s puzzle was hard. This dataviz lets you see how difficult today’s wordle puzzle was for other NY Times Wordle players did.
The graph shows the distribution of guesses needed to solve today’s Wordle puzzle, rounded to the nearest whole percent. It also colors the most common number of guesses to solve the puzzle in green and calculates the average number of guesses. “NS” stands for Not Solved. The lower histogram provides some context for how difficult the day’s puzzle is compared to many other puzzles in the past based on average number of guesses needed to solve the puzzle. It doesn’t include the entire history of wordle, but a subset of days that I was able to gather data on.
Even over 1 year later, I still enjoy playing Wordle. I even made a few Wordle games myself – Wordguessr – Tridle – Scrabwordle. I’ve been enjoying the Wordlebot which does a daily analysis of your game. I especially enjoy how it indicates how “lucky” your guesses were and how they eliminated possible answers until you arrive at the puzzle solution. One thing it also provides is data on the frequency of guesses that are made which provides information on the number of guesses it took to solve each puzzle.
Instructions
Data and Tools
The data comes from playing NY Times Wordle game and using their Wordlebot. Python is used to extract the data and wrangle the data into a clean format. Visualization was done in javascript and specifically the plotly visualization library.
Colorado River Reservoir Levels
How much water is in the main Colorado River reservoirs?
Check out my California Reservoir Levels Dashboard
I based this graph off of my California Reservoir marimekko graph, because many folks were interested in seeing a similar figure for the Colorado river reservoirs.
This is a marimekko (or mekko) graph which may take some time to understand if you aren’t used to seeing them. Each “row” represents one reservoir, with bars showing how much of the reservoir is filled (blue) and unfilled (brown). The height of the “row” indicates how much water the reservoir could hold. Lake Mead is the reservoir with the largest capacity (at almost 29,000 kaf) and so it is the tallest row. The proportion of blue to brown will show how full it is. As with the California version of this graph, there are also lines that represent historical levels, including historical median level for the day of the year (in red) and the 1 year ago level, which is shown as a dark blue line. I also added the “Deadpool” level for the two largest reservoirs. This is the level at which water cannot flow past the dam and is stuck in the reservoir.
Lake Mead and Lake Powell are by far the largest of these reservoirs and also included are several smaller reservoirs (relative to these two) so the bars will be very thin to the point where they are barely a sliver or may not even show up.
Historical Data
Historical data comes from https://www.water-data.com/ and differs for each reservoir.
- Lake Mead – 1941 to 2015
- Lake Powell – 1964 to 2015
- Flaming Gorge – 1972 to 2015
- Lake Mohave – 1952 to 2015
- Lake Navajo – 1969 to 2015
- Blue Mesa – 1969 to 2015
- Lake Havasu – 1939 to 2015
The daily data for each reservoir was captured in this time period and median value for each day of the calendar year was calculated and this is shown as the red line on the graph.
Instructions:
If you are on a computer, you can hover your cursor over a reservoir and the dashboard at the top will provide information about that individual reservoir. If you are on a mobile device you can tap the reservoir to get that same info. It’s not possible to see or really interact with the tiniest slivers. The main goal of this visualization is to provide a quick overview of the status of the main reservoirs along the Colorado River (or that provide water to the Colorado).
Units are in kaf, thousands of acre feet. 1 kaf is the amount of water that would cover 1 acre in one thousand feet of water (or 1000 acres in water in 1 foot of water). It is also the amount of water in a cube that is 352 feet per side (about the length of a football field). Lake Mead is very large and could hold about 35 cubic kilometers of water at full (but not flood) capacity.
Data and Tools
The data on water storage comes from the US Bureau of Reclamation’s Lower Colorado River Water Operations website. Historical reservoir levels comes from the water-data.com website. Python is used to extract the data and wrangle the data in to a clean format, using the Pandas data analysis library. Visualization was done in javascript and specifically the D3.js visualization library.
Visualizing California’s Water Storage – Reservoirs and Snowpack
How much water is stored in California’s snowpack and reservoirs?
California’s snow pack is essentially another “reservoir” that is able to store water in the Sierra Nevada mountains. Graphing these things together can give a better picture of the state of California’s water and drought.
The historical median (i.e. 50th percentile) for snow pack water content is stacked on top of the median for reservoirs storage (shown in two shades of blue). The current water year reservoirs is shown in orange and the current year’s snow pack measurement is stacked on top in green. What is interesting is that the typical peak snow pack (around April 1) holds almost as much water (about 2/3 as much) as the reservoirs typically do. However, the reservoirs can store these volumes for much of the year while the snow pack is very seasonal and only does so for a short period of time.
Snowpack is measured at 125 different snow sensor sites throughout the Sierra Nevada mountains. The reservoir value is the total of 50 of the largest reservoirs in California. In both cases, the median is derived from calculating the median values for each day of the year from historical data from these locations from 1970 to 2021.
I’ve been slowly building out the water tracking visualizations tools/dashboards on this site. And with the recent rains (January 2023), there has been quite a bit of interest in these visualizations. One data visualization that I’ve wanted to create is to combine the precipitation and reservoir data into one overarching figure.
Creating the graph
I recently saw one such figure on Twitter by Mike Dettinger, a researcher who studies water/climate issues. The graph shows the current reservoir and snowpack water content overlaid on the historic levels. It is a great graph that conveys quite a bit of info and I thought I would create an interactive version of these while utilizing the automated data processing that’d I’d already created to make my other graphs/dashboards.
Time for another reservoirs-plus-snowpack storage update….LOT of snow up there now and the big Sierra reservoirs (even Shasta!) are already benefitting. Still mostly below average but moving up. Snow stacking up in UCRB. @CW3E_Scripps @DroughtGov https://t.co/2eZgNArahy pic.twitter.com/YEH4IYKlnH
— Mike Dettinger (@mdettinger) January 15, 2023
The challenge was to convert inches of snow water equivalent into a total volume of water in the snowpack, which I asked Mike about. He pointed me to a paper by Margulis et al 2016 that estimates the total volume of water in the Sierra snowpack for 31 years. Since I already had downloaded data on historical snow water equivalents for these same years, I could correlate the estimated peak snow water volume (in cubic km) to the inches of water at these 120 or so Sierra snow sensor sites. I ran a linear regression on these 30 data points. This allowed me to estimate a scaling factor that converts the inches of water equivalent to a volume of liquid water (and convert to thousands of acre feet, which is the same unit as reservoirs are measured in).
This scaling factor allows me to then graph the snowpack water volume with the reservoir volumes.
See my snowpack visualization/post to see more about snow water equivalents.
My numbers may differ slightly from the numbers reported on the state’s website. The historical percentiles that I calculated are from 1970 until 2020 while I notice the state’s average is between 1990 and 2020.
You can hover (or click) on the graph to audit the data a little more clearly.
Sources and Tools
Data is downloaded from the California Data Exchange Center website of the California Department of Water Resources using a python script. The data is processed in javascript and visualized here using HTML, CSS and javascript and the open source Plotly javascript graphing library.
California Snowpack Levels Visualization
How does the current California snowpack compare with Historical Averages?
If you are looking at this it’s probably winter in California and hopefully snowy in the mountains. In the winter, snow is one of the primary ways that water is stored in California and is on the same order of magnitude as the amount of water in reservoirs.
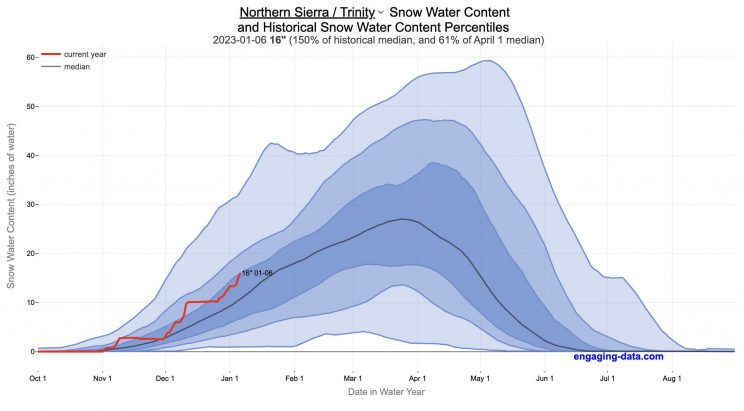
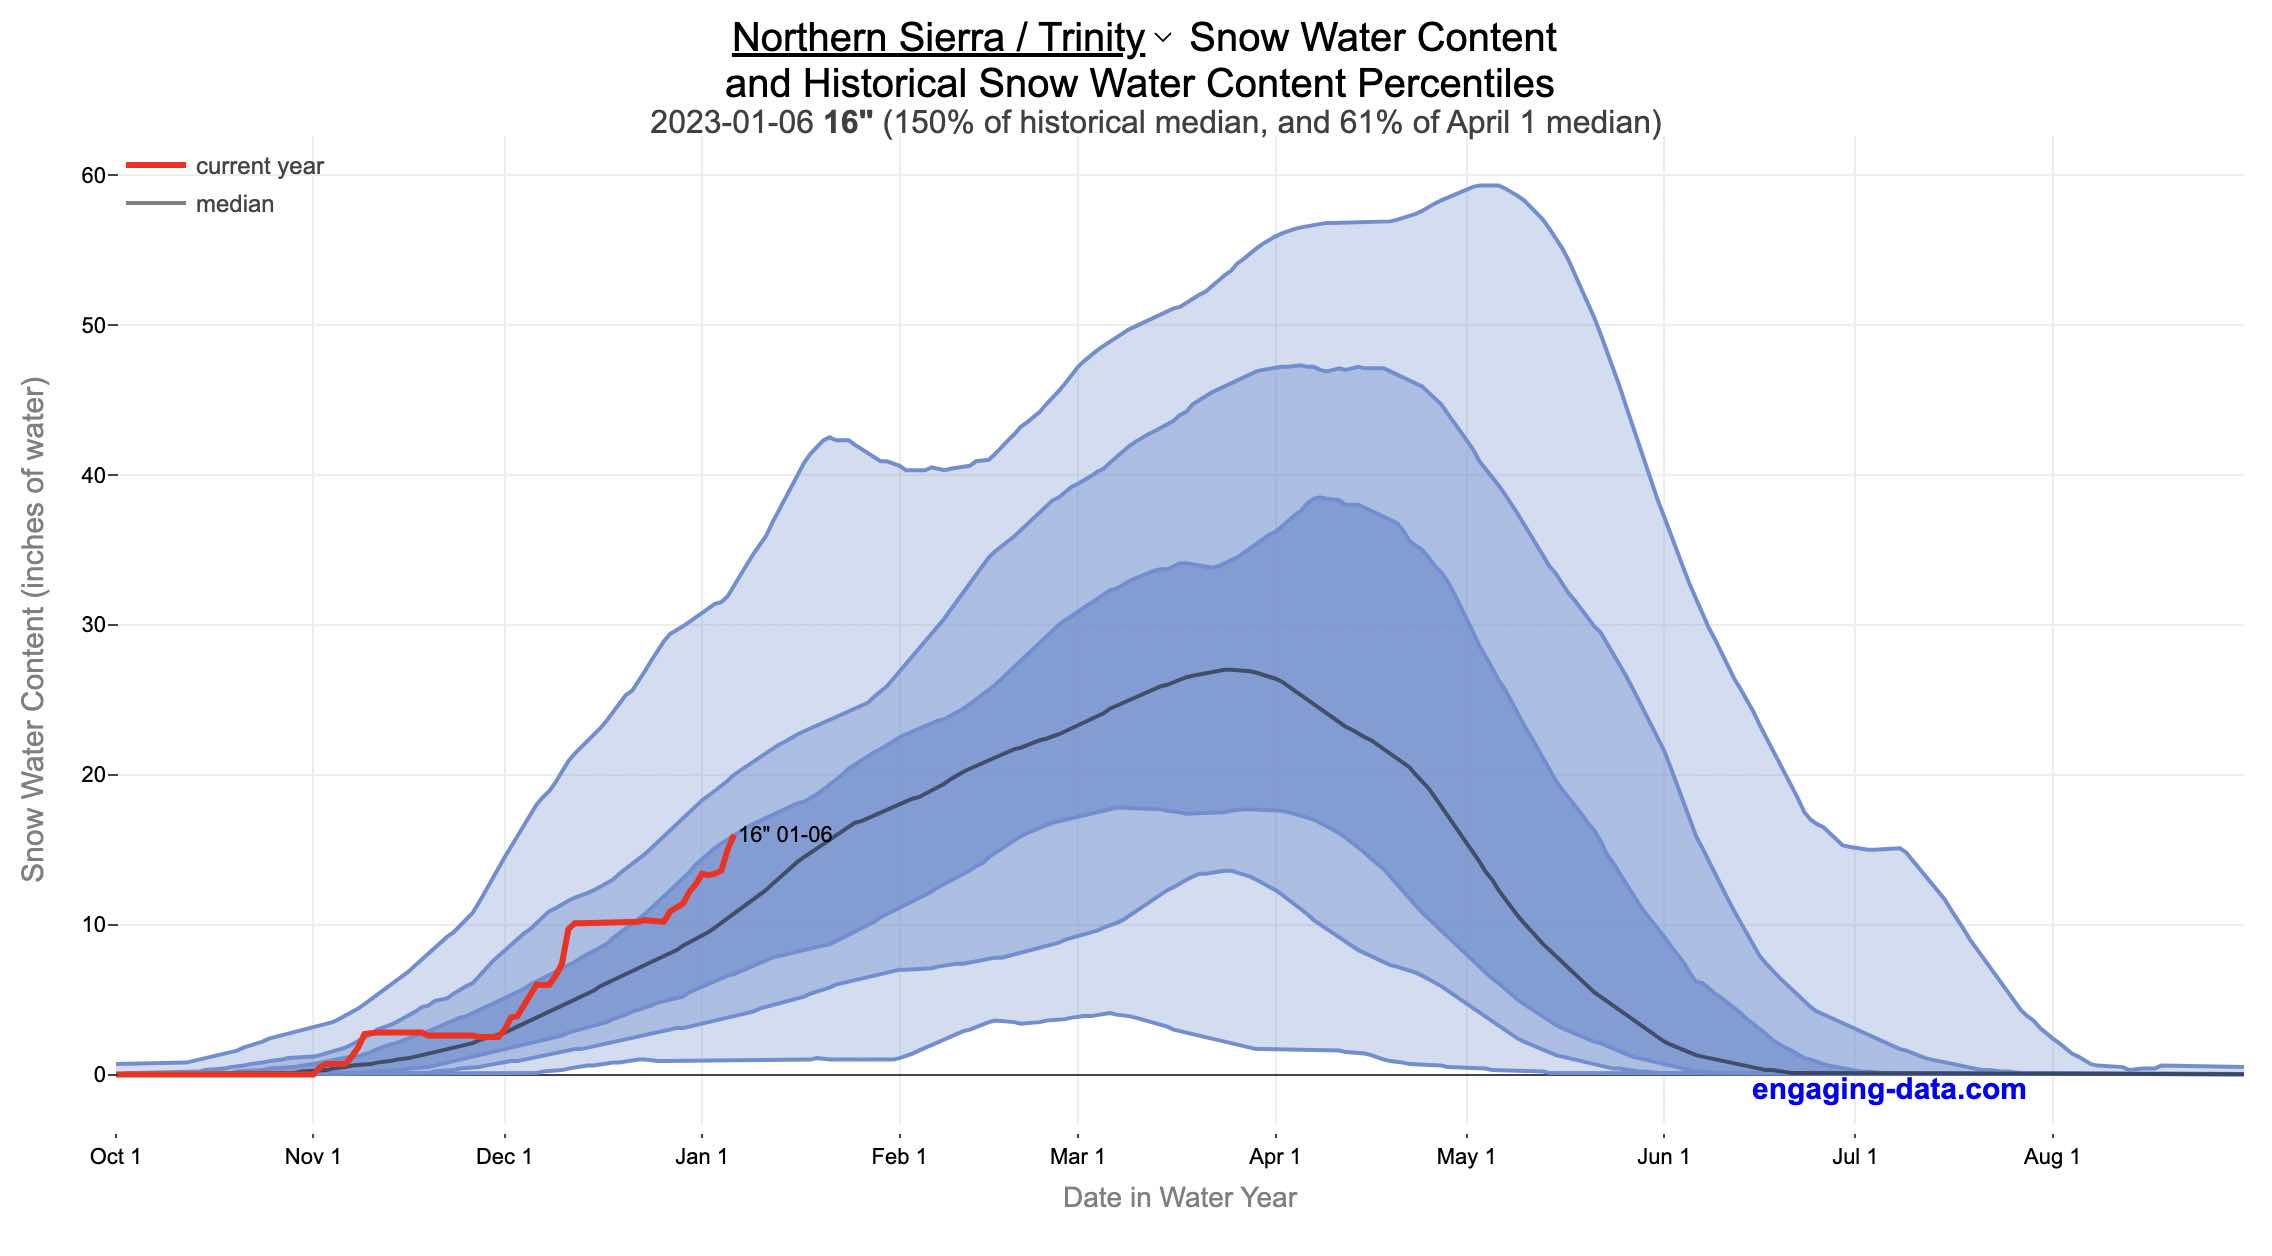
When I made this graph of California snowpack levels (Jan 2023) we’ve had quite a bit of rain and snow so far and so I wanted to visualize how this year compares with historical levels for this time of year. This graph will provide a constantly updated way to keep tabs on the water content in the Sierra snowpack.
Snow water content is just what it sounds like. It is an estimate of the water content of the snow. Since snow can have be relatively dry or moist, and can be fluffy or compacted, measuring snow depth is not as accurate as measuring the amount of water in the snow. There are multiple ways of measuring the water content of snow, including pads under the snow that measure the weight of the overlying snow, sensors that use sound waves and weighing snow cores.
I used data for California snow water content totals from the California Department of Water Resources. Other California water-related visualizations include reservoir levels in the state as well.
There are three sets of stations (and a state average) that are tracked in the data and these plots:
- Northern Sierra/Trinity – (32 snow sensors)
- Central Sierra – (57 snow sensors)
- Southern Sierra – (36 snow sensors)
- State-wide average – (125 snow sensors)
Here is a map showing these three regions.
These stations are tracked because they provide important information about the state’s water supply (most of which originates from the Sierra Nevada Mountains). Winter and spring snowpack forms an important reservoir of water storage for the state as this melting snow will eventually flow into the state’s rivers and reservoirs to serve domestic and agricultural water needs.
The visualization consists of a graph that shows the range of historical values for snow water content as a function of the day of the year. This range is split into percentiles of snow, spreading out like a cone from the start of the water year (October 1) ramping up to the peak in April and then converging back to zero in summertime. You can see the current water year plotted on this in red to show how it compares to historical values.
My numbers may differ slightly from the numbers reported on the state’s website. The historical percentiles that I calculated are from 1970 until 2022 while I notice the state’s average is between 1990 and 2020.
You can hover (or click) on the graph to audit the data a little more clearly.
Sources and Tools
Data is downloaded from the California Data Exchange Center website of the California Department of Water Resources using a python script. The data is processed in javascript and visualized here using HTML, CSS and javascript and the open source Plotly javascript graphing library.
US Baby Name Popularity Visualizer
I added a share button (arrow button) that lets you send a graph with specific name. It copies a custom URL to your clipboard which you can paste into a message/tweet/email.
How popular is your name in US history?
Use this visualization to explore statistics about names, specifically the popularity of different names throughout US history (1880 until 2020). This is a useful tool for seeing the rise (and fall) of popularity of names. Look at names that we think of as old-fashioned, and names that are more modern.
Instructions
- Start typing a name into the input box above and the visualization will show all the names that begin with those letters. The graph will show the historical popularity of all these names as an area graph.
- You can hover (or click on mobile) to bring up a tooltip (popup) that shows you the exact number of births with that name for different years (or decades) and the names rank in that time period.
- It’s best used on computer (rather than a mobile or tablet device) so you can see the graph more clearly and also, if you click on a name wedge, it will zoom into names that begin with those letters.
- You can select different views, Boy names, Girl names or both, as well as looking at the raw number of births or a normalized popularity that accounts for the differential number of births throughout the period between 1880 and 2020.
- If you click the share (arrow) button, it will copy the parameters of the current graph you are looking at and create a custom URL to share with others. It copes the link into your clipboard and your browser’s address (URL) bar.
Isn’t there something out there like this already? Baby Name Wizard and Baby Name Voyager
This visualization is not my original idea, but rather a re-creation of the Baby Name Voyager (from the Baby Name Wizard website) created by Laura Wattenberg. The original visualization disappeared (for some unknown reason) from the web, and I thought it was a shame that we should be deprived of such a fun resource.
It started about a week ago, when I saw on twitter that the Baby Name Wizard website was gone. Here’s the blog post from Laura. I hadn’t used it in probably a decade, but it flashed me back to many years ago well before I got into web programming and dataviz and I remember seeing the Baby Name Voyager and thinking how amazing it was that someone could even make such a thing. Everyone I knew played with it quite a bit when it first came out. It got me thinking that it should still be around and that I could probably make it now with my programming skills and how cool that would be.
So I downloaded the frequency data for Baby Names from the US Social Security Administration and set to work trying to create a stacked area graph of baby names vs time. I started with my go to library for fast dataviz (Plotly.js) but eventually ended up creating the visualization in d3.js which is harder for me, but made it very responsive. I’m not an expert in d3, but know enough that using some similar examples and with lots of googling and stack overflow, I could create what I wanted.
I emailed Laura after creating a sample version, just to make sure it was okay to re-create it as a tribute to the Baby Name Wizard / Voyager and got the okay from her.
Where does the data come from?
Some info about Data (from SSA Baby Names Website):
All names are from Social Security card applications for births that occurred in the United States after 1879. Note that many people born before 1937 never applied for a Social Security card, so their names are not included in our data.
Name data are tabulated from the “First Name” field of the Social Security Card Application. Hyphens and spaces are removed, thus Julie-Anne, Julie Anne, and Julieanne will be counted as a single entry.
Name data are not edited. For example, the sex associated with a name may be incorrect.Different spellings of similar names are not combined. For example, the names Caitlin, Caitlyn, Kaitlin, Kaitlyn, Kaitlynn, Katelyn, and Katelynn are considered separate names and each has its own rank.
All data are from a 100% sample of our records on Social Security card applications as of March 2021.
I did notice that there was a significant under-representation of male names in the early data (before 1910) relative to female names. In the normalized data, I set the data for each sex to 500,000 male and 500,000 female births per million total births, instead of the actual data which shows approximately double the number of female names than male names. Not sure why females would have higher rates of social security applications in the early 20th century. Update: A helpful Redditor pointed me to this blog post which explains some of the wonkiness of the early data. The gist of it is that Social Security cards and numbers weren’t really a thing until 1935. Thus the names of births in 1880 are actually 55 year olds who applied for Social Security numbers and since they weren’t mandatory, they don’t include everyone. My correction basically makes the assumption that this data is actually a survey and we got uneven samples from males and female respondents. It’s not perfect (like the later data) but it’s a decent representation of name distribution.
Sources and Tools:
The biggest source of inspiration was of course, Laura Wattenberg’s original Baby Name Explorer.
I downloaded the baby names from the Social Security website. Thanks to Michael W. Shackleford at the SSA for starting their name data reporting. I used a python script to parse and organize the historical data into the proper format my javascript. The visualization is created using HTML, CSS and Javascript code (and the d3.js visualization library) to create interactivity and UI. Curran Kelleher’s area label d3 javascript library was a huge help for adding the names to the graph.
Compound Interest and Stock Returns Calculator
Calculate returns on regular, periodic investments
This calculator lets you visualize the value of investing regularly. It lets you calculate the compounding from a simple interest rate or looking at specific returns from the stock market indexes or a few different individual stocks.
Instructions
- Enter the amount of money to be invested monthly
- Choose to use an interest rate (and enter a specific rate) or
- Choose a stock market index or individual stock
- Use the slider to change the initial starting date of your periodic investments – You can go as far back as 1970 or the IPO date of the stock if it is later than that.
- Use the “Generate URL to Share” button to create a special URL with the specific parameters of your choice to share with others – the URL will appear in your browser’s address bar.
You can hover over the graph to see the split between the money you invested and the gains from the investment. In most cases (unless returns are very high), initially the investments are the large majority of the total balance, but over time the gains compound and eventually, it is those gains rather than the initial investments that become the majority of the total.
Some of the tech stocks included in the dropdown list have very high annualized returns and thus the gains quickly overtake the additions as the dominant component of the balance and you can make a great deal of money fairly quickly.
It becomes clearer as you move the slider around, that longer investing time periods are the key to increasing your balance, so building financial prosperity through investing is generally more of a marathon and not really a sprint. However, if you invest in individual stocks and pick a good one, you can speed up that process, though it’s not necessarily the most advisable way to proceed. Lots of people underperform the market (i.e. index funds) or even lose money by trying to pick big winners.
Understanding the Calculations
Calculating compound returns is relatively easy and is just a matter of consecutively multiplying the return. If the return is 7% for 5 years, that is equal to multiplying 1.07 five times, i.e. 1.075 = 1.402 (or a 40.2% gain).
In this case, we are adding additional investments each month but the idea is the same. Take the amount of money (or value of shares) and multiply by the return (>1 if positive or <1 for negative returns) after each period of the analysis.
Sources and Tools:
Stock and index monthly data is downloaded from Yahoo! finance is downloaded regularly using a python script.
The graph is created using the open-source Plotly javascript visualization library, as well as HTML, CSS and Javascript code to create interactivity and UI.
Recent Comments