Archive for the ‘Technology’ Category:
Visualizing the Orbit of the International Space Station (ISS)
Where is the International Space Station currently? And what pattern does it make as it orbits around the Earth?
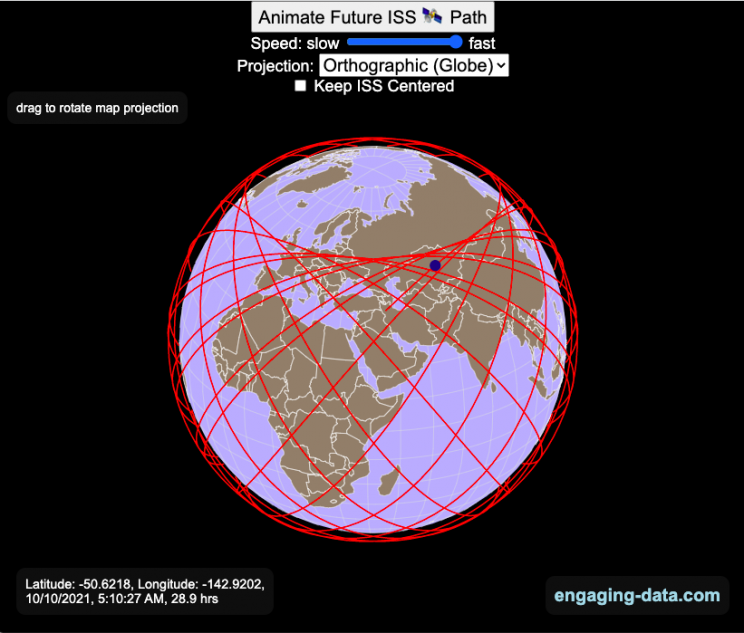
This visualization shows the current location of the International Space Station (ISS), actually the point above the Earth that the station is closest to. It is approximately 260 miles (420 km) above the Earth’s surface The station began construction in 1998 and had its first long term residents in 2000.
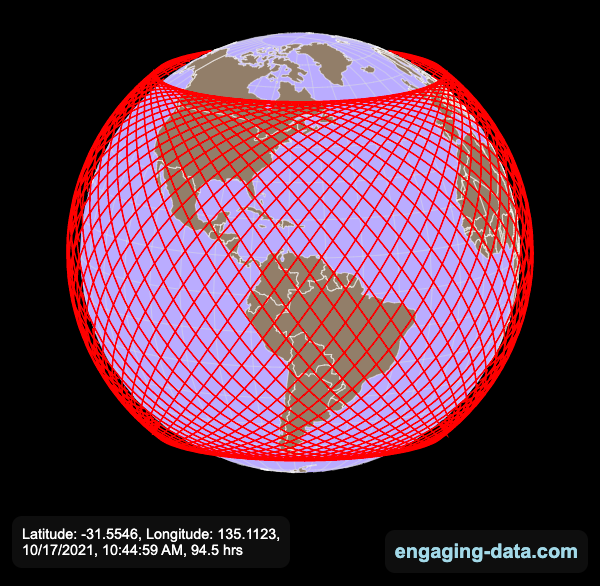
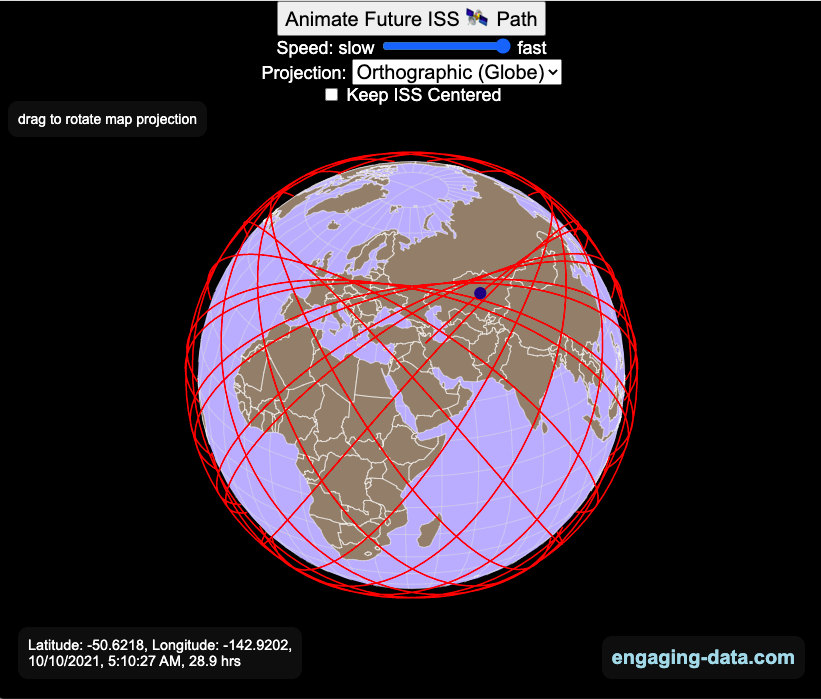
The visualization can also show the animated future orbital path of the ISS using ephemeris calculations, which makes a nice, cool pattern over an approximately 3.9 day cycle, where it starts to repeat. The animation allows you to view the orbital patterns on the globe (orthographic projection) or a mercator or equirectangular projection.
One of the cooler features is to drag and rotate the globe view while the orbital paths are being drawn. You can also adjust the speed of the orbit as well as keep the ISS centered in your view while the globe spins around underneath it. If you select the “rotate earth” checkbox, it becomes apparent that the ISS is in a circular orbit around the earth and that the pattern being made is simply a function of the earth’s rotation underneath the orbit.
This visualization only shows the approximate location of the ISS as there are several confounding factors that are not represented here. The speed of the ISS changes somewhat over time as the station experiences a small amount of atmospheric drag, which slows the station over time. But it still goes over 7000 meters per second or about 17000 miles per hour. As it slows, its orbit decays so it falls closer to earth and it experiences even more atmospheric drag. Occasionally, the station is boosted up to a higher orbit to counteract this decay. Secondly the earth is not a perfect sphere and this also causes the calculations to be only approximately correct.
Some other cool facts about the International Space Station:
- the angle the orbit makes relative to the equator is 51.6 degrees (i.e. this means the highest and lowest latitudes it will reach are 51.6 degrees North and South and doesn’t orbit over the poles
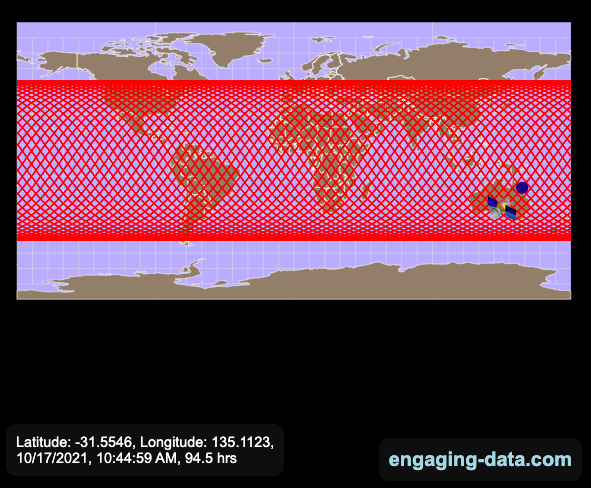
- the circular orbit around the earth makes a sin wave pattern on 2D map projections (shown on the mercator and equirectangular projections
- one orbit takes about 90 minutes. This means there are approximately 16 orbits per day and astronauts aboard the ISS will see 16 sunrises and sunsets
Other cool space-related orbital art can be seen at the inner planet spirographs.
Here are a couple of images showing the final pattern made by the ISS on different map projections.
Sources and Tools:
I used the satellite.js javascript package and the ISS TLE file to calculate the position of the ISS.
The visualization was made using the d3.js open source graphing library and HTML/CSS/Javascript code for the interactivity and UI.
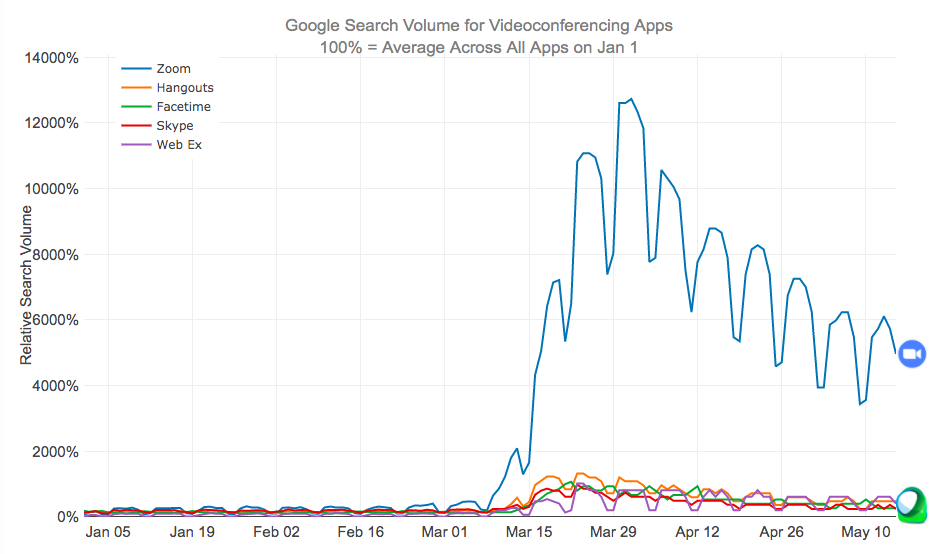
Videoconferencing popularity before and during coronavirus lockdown

Zoom has become the primary video conferencing app over the last few months as schools and workplaces increasingly turned to remote learning and meetings.
Since the shelter-in-place orders across the United States due to the coronavirus in early to mid-March, many things have changed about our daily lives. One of the main ones is that schooling and work is being done remotely through video conferencing apps on our computers, tablets and smartphones. Our kids have zoom meetings with their teachers, parents have zoom meetings with our work colleagues and we all have facetime and google hangouts chats with our friends and family.
I remembered just a few year ago Skype was a very popular app to use for video chats, so I wanted to see how Zoom came to be the most popular app. The animated graph above shows the relative search volumes for 5 popular video conferencing apps from January 1 to May 15th (before and during the coronavirus restrictions on travel and gatherings).
This article implies that the reason Zoom had taken over so much is because it is free and easy to use for consumers. Even my tech-challenged mother is doing zoom calls for friends and classes.
Data and Tools:
Data is from google trends analysis of videoconferencing apps. Data is processed in javascript and graphed using the plotly open source graphing library.
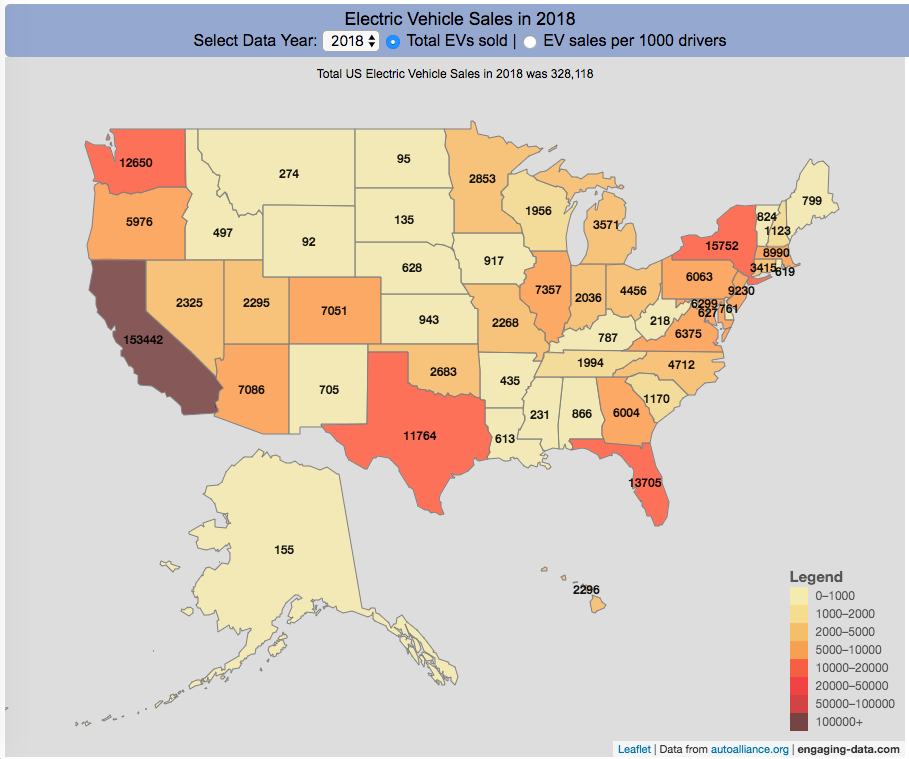
Electric Vehicle Sales By State
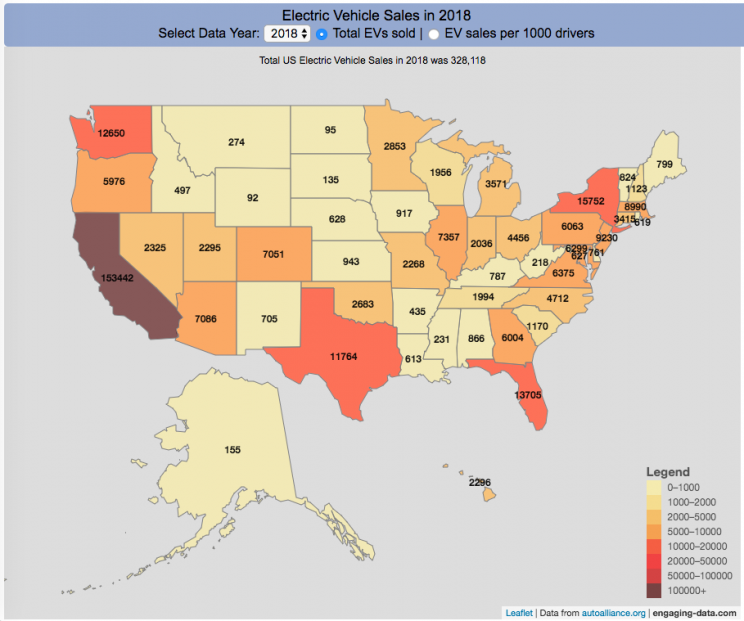
Where are electric vehicles being sold in the United States?
Electric vehicles are any vehicle that can be plugged in to recharge a battery that provides power to move the vehicle. Two broad classes are battery electric vehicles (BEVs) which only have batteries as their power source and plug-in hybrid electric vehicles (PHEVs) which have an alternative or parallel power source, typically a gasoline engine. PHEVs are built so that when the battery is depleted, the car can still run on gasoline and operate like a hybrid vehicle similar to a regular Toyota Prius (which is not plugged in at all).
Electric vehicles (EVs) have been sold in the US since 2011 (a few commercial models were sold previous to that but not in any significant numbers) and some conversions were also available. Since then, the number of EVs sold has increased pretty significantly. I wanted to look at the distribution of where those vehicles were located. What is interesting is that California accounts for around 50% of the electric vehicles sold in the United States. Other states have lower rates of EV adoption (in some cases much, much lower). There are many reasons for this, including beneficial policies, public awareness, a large number of potential early adopters and a mild climate. Even so, the EV heatmap of California done early shows that sales are mostly limited to the Bay Area, and LA areas.
The map shows data for total electric vehicle sales by state for years 2016, 2017 or 2018 and also the number of EV sales per 1000 licensed drivers (this is all people in the state with a drivers license, not drivers of EVs). If you hover over a state, you can see both data points for that state.
It will be interesting to see how the next generation of electric vehicles continues to improve, lower in price and become more popular with drivers outside of early adopters.
Click here to see other Energy-Related visualizations
Data and Tools:
Data on electric vehicle sales is from the Auto Alliance website. Licensed driver data was downloaded from the US Department of Transportation’s Bureau of Transportation Statistics website. The map was made using the leaflet open source mapping library. Data was compiled and calculated using javascript.
Tesla Model 3 Sales Tracker
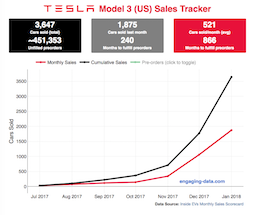
Tesla has been building innovative and industry-leading battery-powered cars for about a decade, starting with the Roadster, and then the Model S and Model X. The company unveiled the Model 3 (their first mass-market electric car with 220 miles of range, priced at “$35,000″), in early 2017 and hundreds of thousands of people put down a $1000 deposit within a few days. Overall, the number of these pre-orders total about half a million! It was impressive for a car most people have not driven or even seen.
The company also has had optimistic timeframes for producing and shipping these vehicle: they had originally estimated production rates of 5000 cars/week by the end of 2017 and 10,000 cars/week(!) in 2018. That’s Civic or Camry levels. These have since been delayed due to reports of “production hell” in scaling up mass production for the vehicles. Given the unprecedented demand and production challenges as Tesla transitions from niche automaker to mass-market production, I thought it would be worthwhile to track the sales of Model 3s as they are built and shipped to customers with the Model 3 Sales Tracker. Average sales price has been far above the $35,000 price initially announced. Production has reportedly passed 5000 cars/week intermittently, if not continuously, in the summer of 2018.
Steve Jobs iPhone introduction wordcloud

My latest “visualization” is a wordcloud of Steve Jobs’ keynote address when he introduced the iPhone in 2007. (more…)
Recent Comments