Posts for Tag: calculator
Age Calculator and Life Visualization
This is a simple age calculator that calculates your age down to the second.
The age calculator should be relatively self-explanatory, just enter your birthdate into the tool. You can also enter the time of birth (if you want to), otherwise it will assume you were born at midnight.
There are two options for viewing your “age”.
- The first (“Numerical Age“) is a table that shows the number of years, months, days, hours, minutes and seconds since you were born. It also shows how long it will be until your next birthday. You can also use the Start Clock button to see your age change each second.
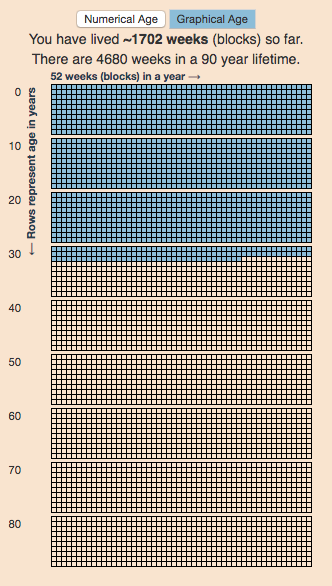
- The second (“Graphical age“) is a figure that shows your age in the context of a 90 year lifespan. Each block shown is one week and there are 52 weeks (blocks) in a year (row) and 10 years (rows) per decade (group of blocks).
This visualization is based on the the very interesting Wait But Why post “Your Life in Weeks” by Tim Urban. It’s a bit humbling to see your life laid out in this way, and to think about how you will spend the (hopefully many) remaining weeks of your life.
You can click the URL button to create a URL that is based on the your birthday (so you don’t have to type it in again). Just copy the URL in the address bar at the top of your browser (after pressing the button) to share with others.
Programming: this program was written in javascript and uses the moment.js library to simplify the date calculations.

FIRE Calculator: When can I retire early?
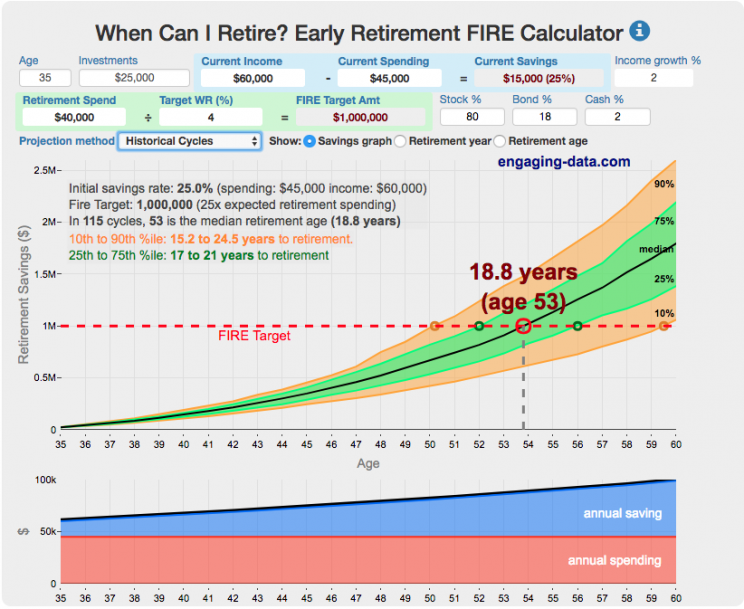
When can I retire and how long do I need to save before I can retire?
That’s the key question! This interactive fire calculator was built to let you play with the inputs and help you understand how savings rate and retirement spending strongly determine how long it will take you to save up for retirement. Note: it does not simulate the post-retirement period when you start to draw down your savings. That can be done on this post-retirement fire calculator (Rich, Broke or Dead) which compares the frequency of various outcomes in retirement (running out of money, ending up with way too much money, and life-expectancy).
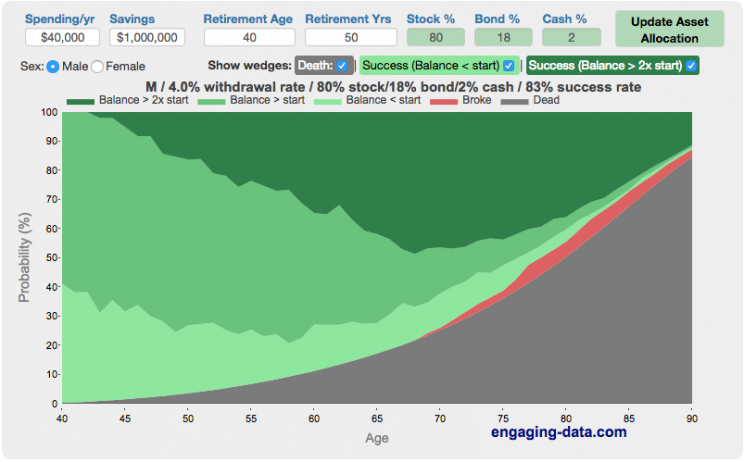
Rich, Broke or Dead? Post-Retirement FIRE Calculator: Visualizing Early Retirement Success and Longevity Risk
Update: June 2025 – bug fix in how tax rate on additional income is applied. If you have a lot of additional income, your success rate will likely go down.
Updated Shiller returns and inflation dataset through beginning of 2024
Rich, Broke or Dead?
One of the key issues with retiring is ensuring that the money you have saved will not be exhausted during your retirement. This is also known as Longevity Risk and is especially important if you want to retire early, since your retirement could be 50 years long (or more). This interactive post-retirement fire calculator and visualization looks at the question of whether your retirement savings can last long enough to support your retirement spending and combines it with average US life expectancy values to get a fuller picture of the likelihood of running out of money before you die.
It helps to answer the question: If I start out with $X dollars at the beginning of my retirement, will I run out of money before I die?
¿Cuánto tardarías en contar hasta un millón?

Disculpe(n) mi pobre español. Utilicé google translate para escribir esto en español.
Aquí está la calculadora que calculará cuánto tiempo lleva contar un millón (o números mayores) en español.
(more…)
Financial Freedom Calculator (Multi-Period FIRE Visualization)
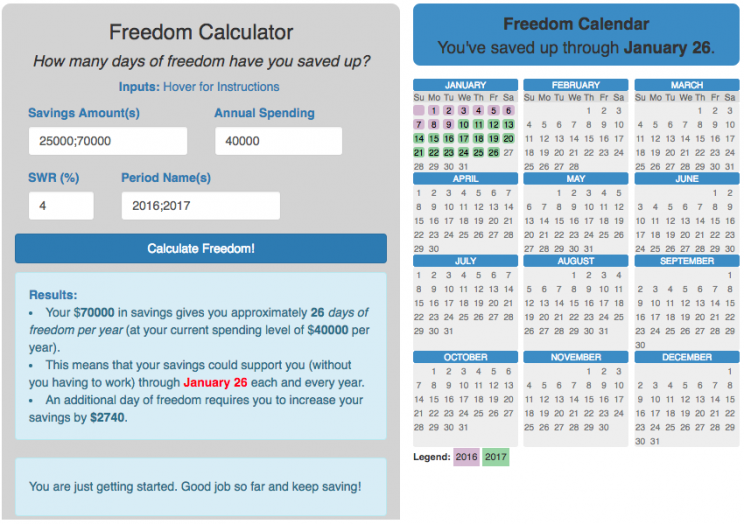
This is an update to the Financial Freedom Calculator. That one still works well, but this version adds the ability to add multiple savings amounts representing different periods in time. This allows you to visualize your progress towards financial freedom rather than just giving you the latest value for your freedom date. It does so by showing different colors for the different periods (you specify them by adding different savings amounts and names). It should be fairly obvious looking at the calculator, but if you had a total of 25000 in savings in 2016 and 70000 in 2017, then your calculator is colored in two sections representing the freedom days you had achieved in the two different years.
(more…)
Counting to One Million, One Billion or One Trillion in Spanish
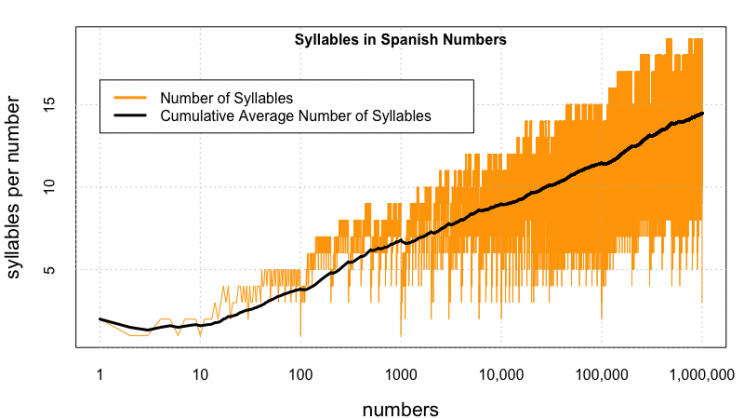
There was lots of interest in the calculator to estimate counting time (in English) to one million, one billion and up to one trillion. I decided to do the same for other popular languages (Spanish). Here is the calculator that will calculate how long it takes to count to one million (or larger numbers) in Spanish. If you’d like to see this in Spanish click here.
(more…)
Age Calculator and Life Visualization
This is a simple age calculator that calculates your age down to the second.
The age calculator should be relatively self-explanatory, just enter your birthdate into the tool. You can also enter the time of birth (if you want to), otherwise it will assume you were born at midnight.
- The first (“Numerical Age“) is a table that shows the number of years, months, days, hours, minutes and seconds since you were born. It also shows how long it will be until your next birthday. You can also use the Start Clock button to see your age change each second.
- The second (“Graphical age“) is a figure that shows your age in the context of a 90 year lifespan. Each block shown is one week and there are 52 weeks (blocks) in a year (row) and 10 years (rows) per decade (group of blocks).
This visualization is based on the the very interesting Wait But Why post “Your Life in Weeks” by Tim Urban. It’s a bit humbling to see your life laid out in this way, and to think about how you will spend the (hopefully many) remaining weeks of your life.
You can click the URL button to create a URL that is based on the your birthday (so you don’t have to type it in again). Just copy the URL in the address bar at the top of your browser (after pressing the button) to share with others.
Programming: this program was written in javascript and uses the moment.js library to simplify the date calculations.
FIRE Calculator: When can I retire early?
When can I retire and how long do I need to save before I can retire?
That’s the key question! This interactive fire calculator was built to let you play with the inputs and help you understand how savings rate and retirement spending strongly determine how long it will take you to save up for retirement. Note: it does not simulate the post-retirement period when you start to draw down your savings. That can be done on this post-retirement fire calculator (Rich, Broke or Dead) which compares the frequency of various outcomes in retirement (running out of money, ending up with way too much money, and life-expectancy).
Rich, Broke or Dead? Post-Retirement FIRE Calculator: Visualizing Early Retirement Success and Longevity Risk
Update: June 2025 – bug fix in how tax rate on additional income is applied. If you have a lot of additional income, your success rate will likely go down.
Updated Shiller returns and inflation dataset through beginning of 2024
Rich, Broke or Dead?
One of the key issues with retiring is ensuring that the money you have saved will not be exhausted during your retirement. This is also known as Longevity Risk and is especially important if you want to retire early, since your retirement could be 50 years long (or more). This interactive post-retirement fire calculator and visualization looks at the question of whether your retirement savings can last long enough to support your retirement spending and combines it with average US life expectancy values to get a fuller picture of the likelihood of running out of money before you die.
It helps to answer the question: If I start out with $X dollars at the beginning of my retirement, will I run out of money before I die?
¿Cuánto tardarías en contar hasta un millón?
Disculpe(n) mi pobre español. Utilicé google translate para escribir esto en español.
Aquí está la calculadora que calculará cuánto tiempo lleva contar un millón (o números mayores) en español.
(more…)
Financial Freedom Calculator (Multi-Period FIRE Visualization)
This is an update to the Financial Freedom Calculator. That one still works well, but this version adds the ability to add multiple savings amounts representing different periods in time. This allows you to visualize your progress towards financial freedom rather than just giving you the latest value for your freedom date. It does so by showing different colors for the different periods (you specify them by adding different savings amounts and names). It should be fairly obvious looking at the calculator, but if you had a total of 25000 in savings in 2016 and 70000 in 2017, then your calculator is colored in two sections representing the freedom days you had achieved in the two different years.
(more…)
Counting to One Million, One Billion or One Trillion in Spanish
There was lots of interest in the calculator to estimate counting time (in English) to one million, one billion and up to one trillion. I decided to do the same for other popular languages (Spanish). Here is the calculator that will calculate how long it takes to count to one million (or larger numbers) in Spanish. If you’d like to see this in Spanish click here.
(more…)
Recent Comments