Posts for Tag: visualization
Financial Freedom Calculator
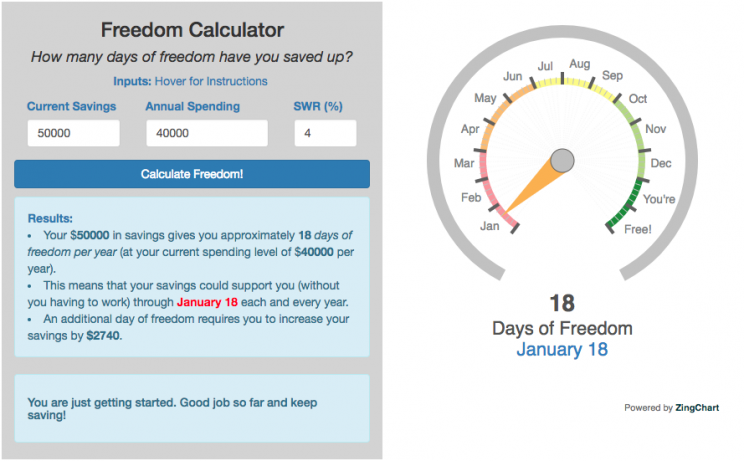 The goal of the freedom calculator is to let you know how close to financial independence (i.e. freedom) you are, measuring your progress in terms of freedom days. The key determinants for retirement are total retirement savings and annual spending.
Freedom days refers to the number of days that your retirement savings could sustain you (without working) each year (indefinitely) at your current spending level. Once you reach 365 freedom days per year, you’ve got enough money saved up to never have to work again. The freedom date then tells you the date through which your retirement savings would support you each year. For example, if you have 100 freedom days then your spending could be covered through April 10th, each year.
How close are you to 365 “freedom days”?
Bay Area Air Quality from Napa and Santa Rosa Fires
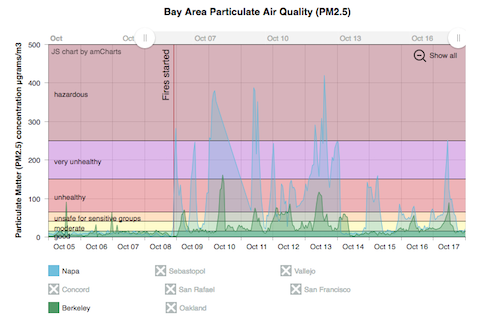
The fires in Napa and Santa Rosa California have been burning for about a week and a half so far and these fires have resulted in numerous deaths (with many more missing), significant property damage (over 4000 buildings), and forced the evacuation of tens of thousands from their homes. Luckily, these fires are mostly contained at this point with incredible work from firefighters and as well as from the weather (link to fire status on the CalFire’s websites on the Tubbs, Atlas, Nuns fires).
Health Insurances Losses from Senate Bill by State
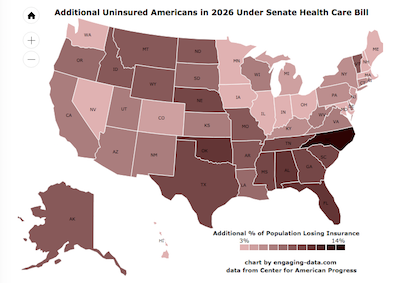
The Congressional Budget Office (CBO) released a report that analyzed the impacts of the Senate health care bill and estimated that 22 million Americans would lose health care by 2026 (see previous post). 22 million amounts to almost 7% of the US population (about 1 in 15 Americans). I wondered how the impacts of these changes would be distributed across different states.
CBO Estimates Number of Uninsured for 2017 Health Care Bills
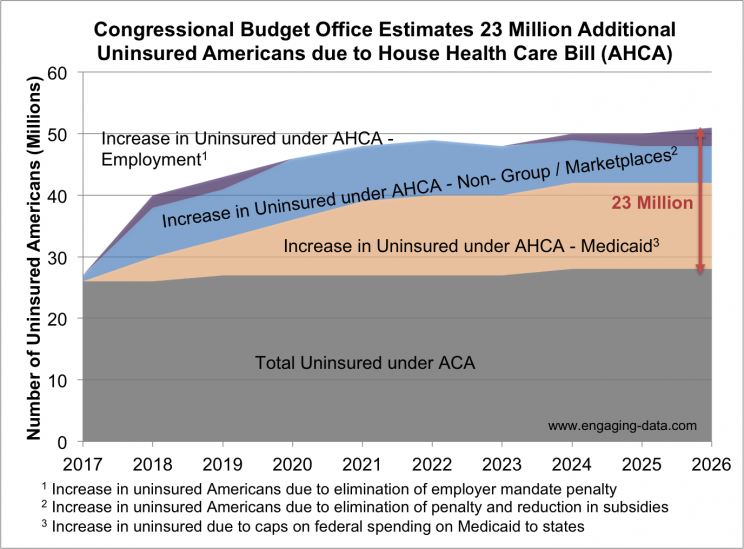
The Congressional Budget Office (CBO) has officially “scored” the Senate Health Care Bill, also officially known as H.R. 1628, the Better Care Reconciliation Act of 2017. Republicans have been adamant about repealing and replacing the Affordable Care Act (ACA), also know as Obamacare, ever since it was first enacted back in 2010. After the election in 2016, when Republicans took control of the Senate, House and Presidency, it seemed likely that they would finally get the chance.
While the ACA is not perfect, seven years of the ACA has helped dramatically reduce the number of uninsured Americans. However, fixing health care is “difficult” and the current bills are expected, according to the non-partisan analysis of the CBO, to lead to a significant increase in the number of uninsured Americans by 2026.
How Fast Are California Reservoirs Filling Up?
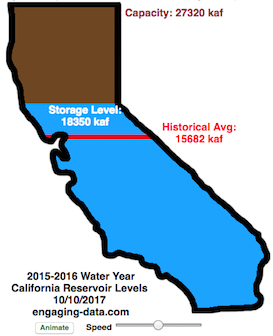
Update: I added a date slider to let you scrub through dates as well as the ability to pause the animation.
In my California water levels visualization, I presented a “bar graph” showing the amount of water currently in California’s reservoirs. However, I thought it’d be interesting to see how this has changed over the course of the last few months, since the state has gotten alot of rain and snow recently.
This visualizations “animates” the graph for recent history (going back to October 1, 2015) showing how the recent rains (or lack thereof) has been caused the levels of the reservoirs in California to rise (and fall).
The historical average represents a daily average reservoir level. It changes for each day of the water year to represent seasonality of precipitation and runoff.
Click the “animate” button below the figure and you can use the slider to change the speed of animation as it cycles through the days. I added a Date slider which lets you scrub through all the dates and animate from different points. (more…)
How Much Water is in California Reservoirs? – Current and Historical Visualization
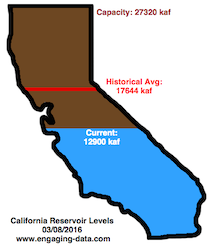
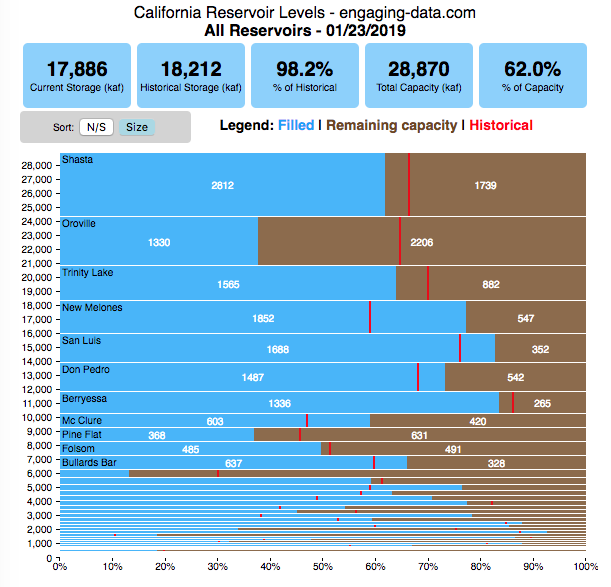
**Check out the new reservoirs dashboard**
California has had an issue with drought, especially for the past few years now. Recently, 2016-2017’s El Nino weather patterns has brought a significant amount of rain to the state and helped alleviate some, but not all, of the major issues.
I’ve been very curious to understand how the rain storms we experience are lessening the impact of the drought, and whether one wet season (like 2016-2017) can really “get the state out of a drought”. One way to assess this is to look at the status of California reservoirs.
Financial Freedom Calculator
Freedom days refers to the number of days that your retirement savings could sustain you (without working) each year (indefinitely) at your current spending level. Once you reach 365 freedom days per year, you’ve got enough money saved up to never have to work again. The freedom date then tells you the date through which your retirement savings would support you each year. For example, if you have 100 freedom days then your spending could be covered through April 10th, each year.
How close are you to 365 “freedom days”?
Bay Area Air Quality from Napa and Santa Rosa Fires
The fires in Napa and Santa Rosa California have been burning for about a week and a half so far and these fires have resulted in numerous deaths (with many more missing), significant property damage (over 4000 buildings), and forced the evacuation of tens of thousands from their homes. Luckily, these fires are mostly contained at this point with incredible work from firefighters and as well as from the weather (link to fire status on the CalFire’s websites on the Tubbs, Atlas, Nuns fires).
Health Insurances Losses from Senate Bill by State
The Congressional Budget Office (CBO) released a report that analyzed the impacts of the Senate health care bill and estimated that 22 million Americans would lose health care by 2026 (see previous post). 22 million amounts to almost 7% of the US population (about 1 in 15 Americans). I wondered how the impacts of these changes would be distributed across different states.
CBO Estimates Number of Uninsured for 2017 Health Care Bills
The Congressional Budget Office (CBO) has officially “scored” the Senate Health Care Bill, also officially known as H.R. 1628, the Better Care Reconciliation Act of 2017. Republicans have been adamant about repealing and replacing the Affordable Care Act (ACA), also know as Obamacare, ever since it was first enacted back in 2010. After the election in 2016, when Republicans took control of the Senate, House and Presidency, it seemed likely that they would finally get the chance.
While the ACA is not perfect, seven years of the ACA has helped dramatically reduce the number of uninsured Americans. However, fixing health care is “difficult” and the current bills are expected, according to the non-partisan analysis of the CBO, to lead to a significant increase in the number of uninsured Americans by 2026.
How Fast Are California Reservoirs Filling Up?
Update: I added a date slider to let you scrub through dates as well as the ability to pause the animation.
In my California water levels visualization, I presented a “bar graph” showing the amount of water currently in California’s reservoirs. However, I thought it’d be interesting to see how this has changed over the course of the last few months, since the state has gotten alot of rain and snow recently.
This visualizations “animates” the graph for recent history (going back to October 1, 2015) showing how the recent rains (or lack thereof) has been caused the levels of the reservoirs in California to rise (and fall).
The historical average represents a daily average reservoir level. It changes for each day of the water year to represent seasonality of precipitation and runoff.
Click the “animate” button below the figure and you can use the slider to change the speed of animation as it cycles through the days. I added a Date slider which lets you scrub through all the dates and animate from different points. (more…)
How Much Water is in California Reservoirs? – Current and Historical Visualization
**Check out the new reservoirs dashboard**
California has had an issue with drought, especially for the past few years now. Recently, 2016-2017’s El Nino weather patterns has brought a significant amount of rain to the state and helped alleviate some, but not all, of the major issues.
I’ve been very curious to understand how the rain storms we experience are lessening the impact of the drought, and whether one wet season (like 2016-2017) can really “get the state out of a drought”. One way to assess this is to look at the status of California reservoirs.
Recent Comments