Posts for Tag: Monte Carlo simulation
Estimating pi (π) using Monte Carlo Simulation

This interactive simulation estimates the value of the fundamental constant, pi (π), by drawing lots of random points to estimate the relative areas of a square and an inscribed circle.
Pi, (π), is used in a number of math equations related to circles, including calculating the area, circumference, etc. and is widely used in geometry, trigonometry and physics.
This app estimates the value of pi by comparing the area of a square and an inscribed circle. The areas are calculated by randomly placing dots into the square and then counting how many of them are also inside the circle. If you do this enough times, you will get a rough ratio of the relative areas of the two shapes. These points are plotted on the graph (red if the fall inside the circle and blue if the fall outside).
Also shown on the graph is the value of our estimate of pi as the simulation progresses, from a few points to many thousands, to millions of points. We can see that when we have only a few points, the value may not be very accurate but as the number of points increases the value of our estimate gets closer to the true value. Running the simulation will add and plot 1 million points. After the first 100 points are added, the rate at which points are added increases. You’ll notice this as the speed at which dots fills up the square increases and because the plot is shown with a logarithmic x-axis.
Here is the math:
Length of side of square: $2 \times r$
radius of circle: $r$
Area of square: $A_{square} = 4r^2$
Area of circle: $A_{circle} = \pi r^2$
The ratio of areas is $A_{circle}/A_{square} = \pi r^2 / 4r^2 = \pi / 4$
Solving for pi: $\pi = 4 \times A_{circle}/A_{square} \approx 4 \times N_{dots_{circle}}/N_{dots_{square}}$
So pi is estimated as 4 times the ratio of dots in the circle vs square
Tools:
This was programmed in javascript, canvas and plotted using the open source plotly javascript plotting library.

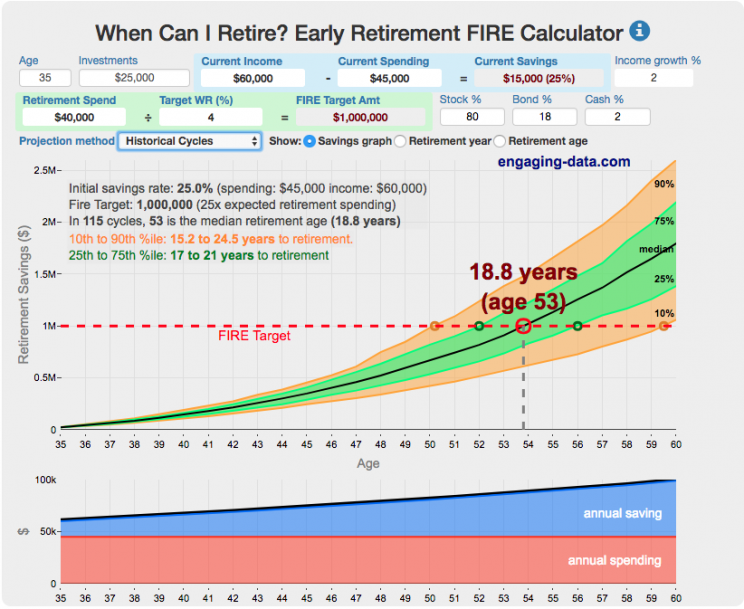
FIRE Calculator: When can I retire early?

When can I retire and how long do I need to save before I can retire?
That’s the key question! This interactive fire calculator was built to let you play with the inputs and help you understand how savings rate and retirement spending strongly determine how long it will take you to save up for retirement. Note: it does not simulate the post-retirement period when you start to draw down your savings. That can be done on this post-retirement fire calculator (Rich, Broke or Dead) which compares the frequency of various outcomes in retirement (running out of money, ending up with way too much money, and life-expectancy).
Estimating pi (π) using Monte Carlo Simulation

This interactive simulation estimates the value of the fundamental constant, pi (π), by drawing lots of random points to estimate the relative areas of a square and an inscribed circle.
Pi, (π), is used in a number of math equations related to circles, including calculating the area, circumference, etc. and is widely used in geometry, trigonometry and physics.
This app estimates the value of pi by comparing the area of a square and an inscribed circle. The areas are calculated by randomly placing dots into the square and then counting how many of them are also inside the circle. If you do this enough times, you will get a rough ratio of the relative areas of the two shapes. These points are plotted on the graph (red if the fall inside the circle and blue if the fall outside).
Also shown on the graph is the value of our estimate of pi as the simulation progresses, from a few points to many thousands, to millions of points. We can see that when we have only a few points, the value may not be very accurate but as the number of points increases the value of our estimate gets closer to the true value. Running the simulation will add and plot 1 million points. After the first 100 points are added, the rate at which points are added increases. You’ll notice this as the speed at which dots fills up the square increases and because the plot is shown with a logarithmic x-axis.
Here is the math:
Length of side of square: $2 \times r$
radius of circle: $r$
Area of square: $A_{square} = 4r^2$
Area of circle: $A_{circle} = \pi r^2$
The ratio of areas is $A_{circle}/A_{square} = \pi r^2 / 4r^2 = \pi / 4$
Solving for pi: $\pi = 4 \times A_{circle}/A_{square} \approx 4 \times N_{dots_{circle}}/N_{dots_{square}}$
So pi is estimated as 4 times the ratio of dots in the circle vs square
Tools:
This was programmed in javascript, canvas and plotted using the open source plotly javascript plotting library.

FIRE Calculator: When can I retire early?

When can I retire and how long do I need to save before I can retire?
That’s the key question! This interactive fire calculator was built to let you play with the inputs and help you understand how savings rate and retirement spending strongly determine how long it will take you to save up for retirement. Note: it does not simulate the post-retirement period when you start to draw down your savings. That can be done on this post-retirement fire calculator (Rich, Broke or Dead) which compares the frequency of various outcomes in retirement (running out of money, ending up with way too much money, and life-expectancy).

Recent Comments