Posts for Tag: interactive
Solar (Sun) Intensity By Location and Time
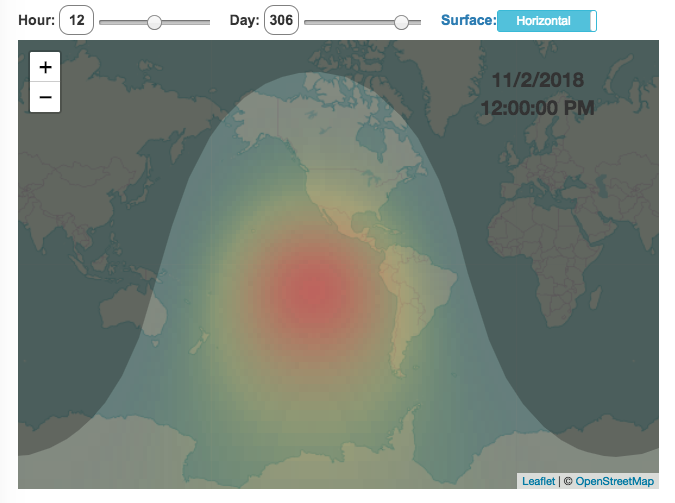
This visualization shows the amount of solar intensity (also called solar insolation and measured in watts per square meter) all across the globe as a function of time of day and day of year. This is an idealized calculation as it does not take into account reductions in solar intensity due to cloud cover or other things that might block the sun from reaching the earth (e.g dust and pollution).
As would be expected, the highest amount of solar intensity occurs on the globe right where the sun is overhead and as the angle of the sun lowers, the solar intensity declines. This is why the area around the equator and up through the tropics is so sunny, the sun is overhead here the most. If you click on the map you should see a popup of the intensity of sunlight at that location.
As the earth rotates over the course of a day, the angle of the sun changes and eventually the angle is so low, the sun is blocked by the horizon (this is sunset).
Instructions
- The default is to show the sunlight intensity for the current date and time but you can change it by moving the sliders for hour or day.
- You can also toggle between the orientation of the surface that you measure the sunlight on. The default shows the intensity of sunlight on a horizontal surface. The other option shows the intensity on a surface that is oriented to face the sun (i.e. perpendicular)
Again, the intensity will depend on the angle it makes with the sun and so it depends on your location on earth (i.e. latitude). Latitudes around the equator will receive more sunlight because their angle is closer to perpendicular.
Shifting through the days of the year, you can start to see the cause of the seasons as the amount of sunlight changes and more or less sunlight goes to each of the northern and southern hemispheres.
Calculations and Tools:
The calculations for solar intensity are based on equations from “Renewable and Efficient Electric Power Systems” by Gilbert Masters Chapter 7. Calculations were made using javascript and visualized using the Leaflet.js library with Open Street Map tiles.
This was a fun project for me to learn online mapping tools and programming.

Most Stressed States

Long-term stress has been shown to be detrimental for your health. While it’s probably not possible to completely eliminate stress from people’s lives, there are many individual choices and decisions that can influence the amount of stress that people experience, including where they live, what job they have, their socio-economic conditions etc. . . One interesting bit of data analysis looks at an aggregate level to understand how stress differs from state to state depending on specific economic, demographic and other geographic factors.
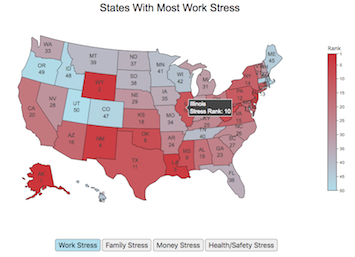
This post shows a map of the most stressed states in the United States. The map is color coded from red (most stress) to blue (least stress) as a ranked list. Stress is divided into several categories including:
- Work Stress is calculated from data on work hours, commute times, job security, unemployment rate, income growth and other metrics.
- Money Stress is calculated from data on income, debt, credit scores, bankruptcy, housing affordability, poverty levels and other metrics.
- Family Stress is calculated from data on divorce rates, single parents, childcare costs, parental leave policies and other metrics.
- Health and Safety Stress is calculated from data on adult health, depression, mental health, health insurance, physical activity rate, crime rate, and other metrics.
Click on the buttons below the map to switch between the different categories.
Data and tools: The data comes from Wallethub’s analysis of data from a wide range of sources including the US Census, BLS, CDC etc.. Unfortunately the data used is a ranked list rather than a set of scores. The ranking doesn’t tell you if a state is 10% more stressful or 10 times more stressful, just that one is higher than the other. Click the link for a full description of their methodology and data sources. The choropleth map was created using javascript to parse the data and the plot.ly open source graphing library to visualize it.
Age Calculator and Life Visualization
This is a simple age calculator that calculates your age down to the second.
The age calculator should be relatively self-explanatory, just enter your birthdate into the tool. You can also enter the time of birth (if you want to), otherwise it will assume you were born at midnight.
There are two options for viewing your “age”.
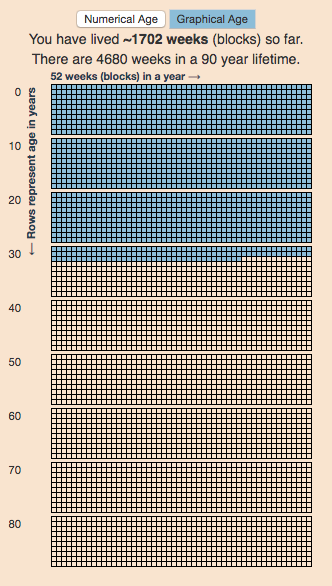
- The first (“Numerical Age“) is a table that shows the number of years, months, days, hours, minutes and seconds since you were born. It also shows how long it will be until your next birthday. You can also use the Start Clock button to see your age change each second.
- The second (“Graphical age“) is a figure that shows your age in the context of a 90 year lifespan. Each block shown is one week and there are 52 weeks (blocks) in a year (row) and 10 years (rows) per decade (group of blocks).
This visualization is based on the the very interesting Wait But Why post “Your Life in Weeks” by Tim Urban. It’s a bit humbling to see your life laid out in this way, and to think about how you will spend the (hopefully many) remaining weeks of your life.
You can click the URL button to create a URL that is based on the your birthday (so you don’t have to type it in again). Just copy the URL in the address bar at the top of your browser (after pressing the button) to share with others.
Programming: this program was written in javascript and uses the moment.js library to simplify the date calculations.

FIRE Calculator: When can I retire early?
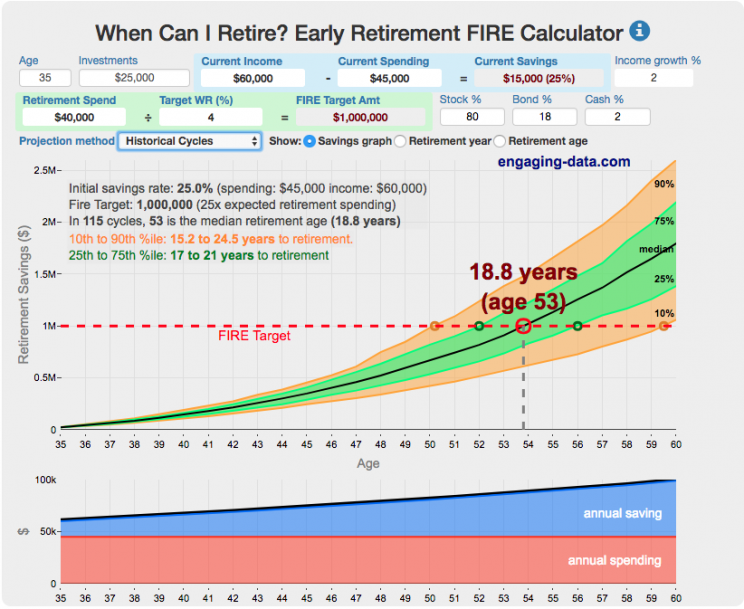
When can I retire and how long do I need to save before I can retire?
That’s the key question! This interactive fire calculator was built to let you play with the inputs and help you understand how savings rate and retirement spending strongly determine how long it will take you to save up for retirement. Note: it does not simulate the post-retirement period when you start to draw down your savings. That can be done on this post-retirement fire calculator (Rich, Broke or Dead) which compares the frequency of various outcomes in retirement (running out of money, ending up with way too much money, and life-expectancy).
Rich, Broke or Dead? Post-Retirement FIRE Calculator: Visualizing Early Retirement Success and Longevity Risk
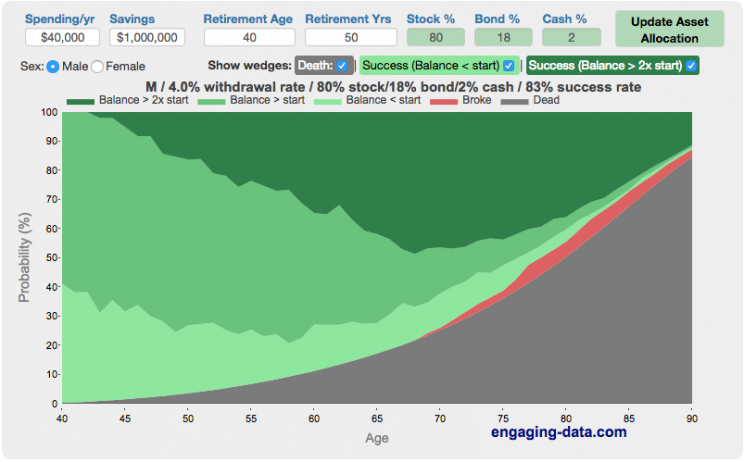
Update: June 2025 – bug fix in how tax rate on additional income is applied. If you have a lot of additional income, your success rate will likely go down.
Updated Shiller returns and inflation dataset through beginning of 2024
Rich, Broke or Dead?
One of the key issues with retiring is ensuring that the money you have saved will not be exhausted during your retirement. This is also known as Longevity Risk and is especially important if you want to retire early, since your retirement could be 50 years long (or more). This interactive post-retirement fire calculator and visualization looks at the question of whether your retirement savings can last long enough to support your retirement spending and combines it with average US life expectancy values to get a fuller picture of the likelihood of running out of money before you die.
It helps to answer the question: If I start out with $X dollars at the beginning of my retirement, will I run out of money before I die?
Should You Invest Or Wait When The Stock Market Is At An All-Time-High?
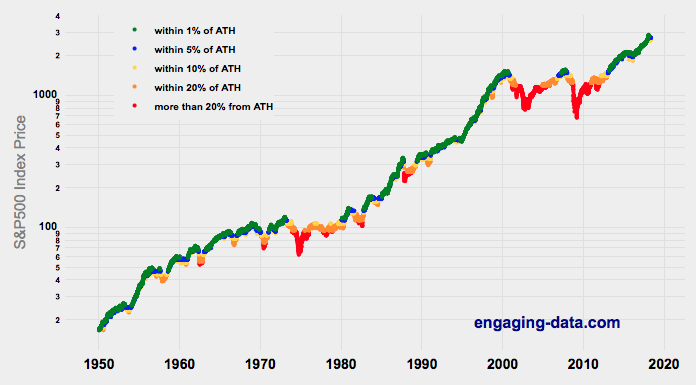
Whenever there’s been an extended bull run, one question that comes to mind “Should I invest in the market now, or wait until a pullback?” The question comes about because of fear and loss aversion: fear that the market will drop right after they invest and the observation that people want to avoid losses more than they value gains. However, historically, the correct answer, at least over the last 70+ years, has been to invest and not to try to time the market.
This was also demonstrated in the Market Timing Game; that people are pretty bad at predicting the direction of the markets and given the upward trend of the market, it’s simpler and more likely than not, better to just stay invested in the market. The corollary to this is that when you have additional money to invest (e.g. from regular savings from your paycheck or a one-time event like the sale of a house), it makes sense to invest the money and not worry about whether the market is at a high or low point. Some graphs that look at the distribution of returns when the market is at an all time high (ATH) can help answer this question of whether you expect to see worse returns than investing at other times.
(more…)
Solar (Sun) Intensity By Location and Time
This visualization shows the amount of solar intensity (also called solar insolation and measured in watts per square meter) all across the globe as a function of time of day and day of year. This is an idealized calculation as it does not take into account reductions in solar intensity due to cloud cover or other things that might block the sun from reaching the earth (e.g dust and pollution).
As would be expected, the highest amount of solar intensity occurs on the globe right where the sun is overhead and as the angle of the sun lowers, the solar intensity declines. This is why the area around the equator and up through the tropics is so sunny, the sun is overhead here the most. If you click on the map you should see a popup of the intensity of sunlight at that location.
As the earth rotates over the course of a day, the angle of the sun changes and eventually the angle is so low, the sun is blocked by the horizon (this is sunset).
Instructions
- The default is to show the sunlight intensity for the current date and time but you can change it by moving the sliders for hour or day.
- You can also toggle between the orientation of the surface that you measure the sunlight on. The default shows the intensity of sunlight on a horizontal surface. The other option shows the intensity on a surface that is oriented to face the sun (i.e. perpendicular)
Again, the intensity will depend on the angle it makes with the sun and so it depends on your location on earth (i.e. latitude). Latitudes around the equator will receive more sunlight because their angle is closer to perpendicular.
Shifting through the days of the year, you can start to see the cause of the seasons as the amount of sunlight changes and more or less sunlight goes to each of the northern and southern hemispheres.
Calculations and Tools:
The calculations for solar intensity are based on equations from “Renewable and Efficient Electric Power Systems” by Gilbert Masters Chapter 7. Calculations were made using javascript and visualized using the Leaflet.js library with Open Street Map tiles.
This was a fun project for me to learn online mapping tools and programming.
Most Stressed States
Long-term stress has been shown to be detrimental for your health. While it’s probably not possible to completely eliminate stress from people’s lives, there are many individual choices and decisions that can influence the amount of stress that people experience, including where they live, what job they have, their socio-economic conditions etc. . . One interesting bit of data analysis looks at an aggregate level to understand how stress differs from state to state depending on specific economic, demographic and other geographic factors.
- Work Stress is calculated from data on work hours, commute times, job security, unemployment rate, income growth and other metrics.
- Money Stress is calculated from data on income, debt, credit scores, bankruptcy, housing affordability, poverty levels and other metrics.
- Family Stress is calculated from data on divorce rates, single parents, childcare costs, parental leave policies and other metrics.
- Health and Safety Stress is calculated from data on adult health, depression, mental health, health insurance, physical activity rate, crime rate, and other metrics.
Click on the buttons below the map to switch between the different categories.
Data and tools: The data comes from Wallethub’s analysis of data from a wide range of sources including the US Census, BLS, CDC etc.. Unfortunately the data used is a ranked list rather than a set of scores. The ranking doesn’t tell you if a state is 10% more stressful or 10 times more stressful, just that one is higher than the other. Click the link for a full description of their methodology and data sources. The choropleth map was created using javascript to parse the data and the plot.ly open source graphing library to visualize it.
Age Calculator and Life Visualization
This is a simple age calculator that calculates your age down to the second.
The age calculator should be relatively self-explanatory, just enter your birthdate into the tool. You can also enter the time of birth (if you want to), otherwise it will assume you were born at midnight.
- The first (“Numerical Age“) is a table that shows the number of years, months, days, hours, minutes and seconds since you were born. It also shows how long it will be until your next birthday. You can also use the Start Clock button to see your age change each second.
- The second (“Graphical age“) is a figure that shows your age in the context of a 90 year lifespan. Each block shown is one week and there are 52 weeks (blocks) in a year (row) and 10 years (rows) per decade (group of blocks).
This visualization is based on the the very interesting Wait But Why post “Your Life in Weeks” by Tim Urban. It’s a bit humbling to see your life laid out in this way, and to think about how you will spend the (hopefully many) remaining weeks of your life.
You can click the URL button to create a URL that is based on the your birthday (so you don’t have to type it in again). Just copy the URL in the address bar at the top of your browser (after pressing the button) to share with others.
Programming: this program was written in javascript and uses the moment.js library to simplify the date calculations.
FIRE Calculator: When can I retire early?
When can I retire and how long do I need to save before I can retire?
That’s the key question! This interactive fire calculator was built to let you play with the inputs and help you understand how savings rate and retirement spending strongly determine how long it will take you to save up for retirement. Note: it does not simulate the post-retirement period when you start to draw down your savings. That can be done on this post-retirement fire calculator (Rich, Broke or Dead) which compares the frequency of various outcomes in retirement (running out of money, ending up with way too much money, and life-expectancy).
Rich, Broke or Dead? Post-Retirement FIRE Calculator: Visualizing Early Retirement Success and Longevity Risk
Update: June 2025 – bug fix in how tax rate on additional income is applied. If you have a lot of additional income, your success rate will likely go down.
Updated Shiller returns and inflation dataset through beginning of 2024
Rich, Broke or Dead?
One of the key issues with retiring is ensuring that the money you have saved will not be exhausted during your retirement. This is also known as Longevity Risk and is especially important if you want to retire early, since your retirement could be 50 years long (or more). This interactive post-retirement fire calculator and visualization looks at the question of whether your retirement savings can last long enough to support your retirement spending and combines it with average US life expectancy values to get a fuller picture of the likelihood of running out of money before you die.
It helps to answer the question: If I start out with $X dollars at the beginning of my retirement, will I run out of money before I die?
Should You Invest Or Wait When The Stock Market Is At An All-Time-High?
Whenever there’s been an extended bull run, one question that comes to mind “Should I invest in the market now, or wait until a pullback?” The question comes about because of fear and loss aversion: fear that the market will drop right after they invest and the observation that people want to avoid losses more than they value gains. However, historically, the correct answer, at least over the last 70+ years, has been to invest and not to try to time the market.
This was also demonstrated in the Market Timing Game; that people are pretty bad at predicting the direction of the markets and given the upward trend of the market, it’s simpler and more likely than not, better to just stay invested in the market. The corollary to this is that when you have additional money to invest (e.g. from regular savings from your paycheck or a one-time event like the sale of a house), it makes sense to invest the money and not worry about whether the market is at a high or low point. Some graphs that look at the distribution of returns when the market is at an all time high (ATH) can help answer this question of whether you expect to see worse returns than investing at other times.
(more…)
Recent Comments