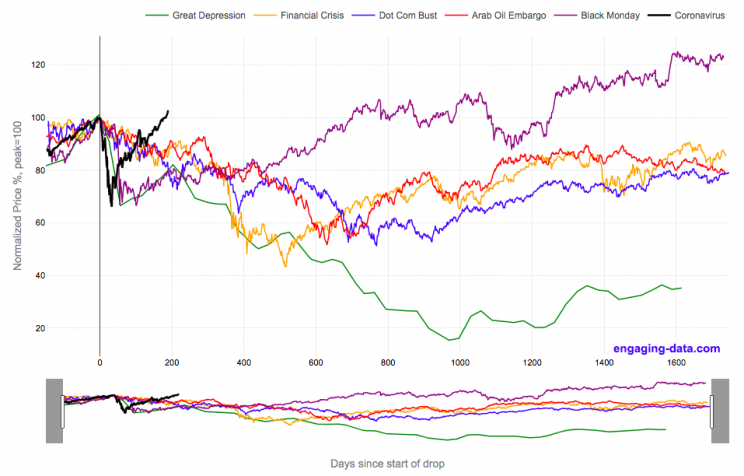
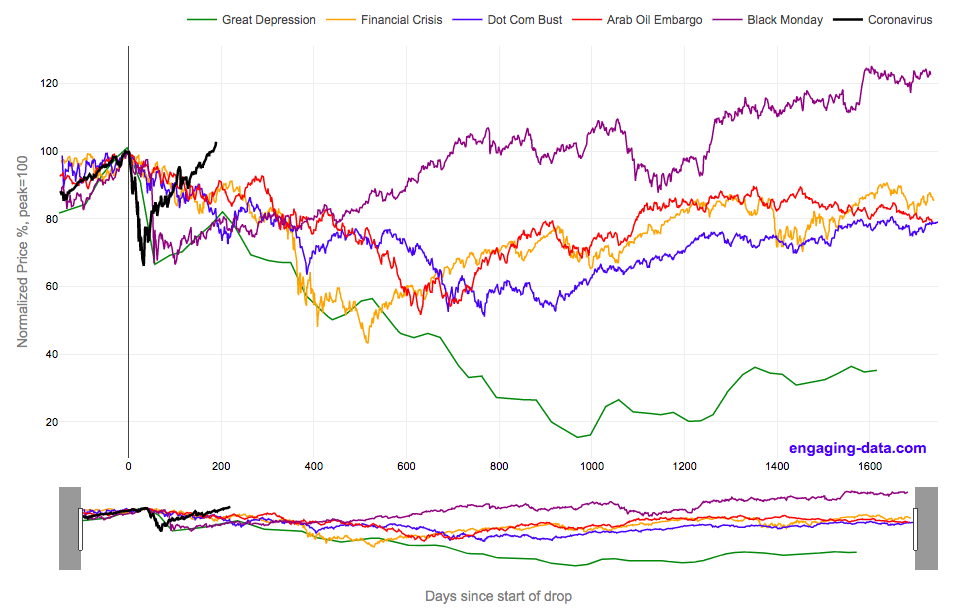
2020’s stock market drop was unprecedented for the speed of the drop and also the speed of the recovery
This graph shows the stock market drops from the 2020 and other bear markets normalized so that the peak is at 100% at day 0. This lets you see the severity and duration of different bear markets from the Great Depression (1929), the Dot Com Bust (2000), and the Financial Crisis (2008) and other drops over 30%.
The coronavirus pandemic has significantly disrupted the global economy. Q2 GDP in the United States declined at an annualized rate of 32% and US unemployment reaching 15% due to coronavirus induced business shutdowns.
However, the stock market drop (represented by the S&P500 index) in late February and early March 2020 has somewhat surprisingly rebounded and reached a new all-time-high in August 2020, even as unemployment and GDP output has continued to falter. There certainly seems to be a disconnect between the fundamentals of the economy and the stock market.
Will the recovery in the stock markets continue or will it begin to align more closely with the fundamentals of the economy?
There are many proposed reasons why this disconnect is happening. The Federal Reserve actions to increase liquidity and prop up the stock market. The heavy weighting of tech in the S&P500 and the pandemic’s boost to many tech company’s business (i.e. Amazon, Zoom, Apple). Whatever the reason, the question of whether the market can continue at this pace or will have a correction is important and one to watch.
Data for the S&P500 price is daily from 1950 onward but before 1950, the data I had available was on a monthly basis. I interpolated this monthly data to create daily data, so not all the data is 100% accurate for any given day before 1950. Data for 2020 will continue to be updated daily.
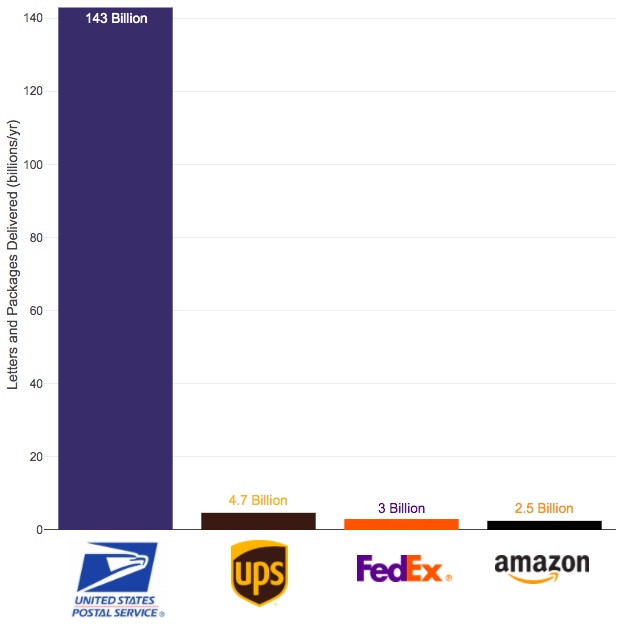
The US Postal Service mail volume is enormous and can’t easily be replaced by private delivery services
The US Postal Service (USPS) has been getting a good deal of press recently because of Trump’s attacks on the security of mail in voting and recent moves by political appointees to reduce the capability of the agency to delivery mail in a timely fashion. These changes reportedly include removing mail sorting equipment and changing overtime hours.
Some have suggested privatizing the postal service but currently the volume of mail and packages through private delivery services is far smaller than that carried by the federal agency.
Note that the USPS carries about 55 billion pieces of first class mail annually out of the reported 143 billion pieces of total mail.
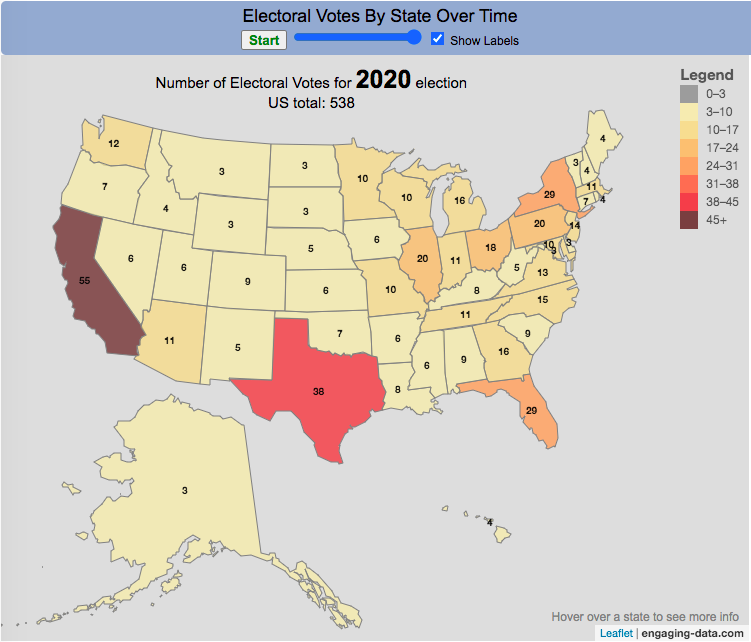
How many electoral votes did each state have across two centuries of elections?
This animation shows the number of electoral votes each state had during each of the 59 presidential elections in US history between 1788 and 2020. It’s interesting to see the number of US states and their relative population sizes (in terms of electoral votes) over many different presidential elections. The population is counted every 10 years in the census so if a presidential election occurs between a census, it likely will not see any difference in numbers of electoral votes, unless something else happens (such as addition of a new state to the country).
Instructions
You can use the slider to control the election year to focus on a specific election and toggle the animation by hitting the Start/Stop button. Hovering over each state will tell you the number of electoral votes and the percentage of the total number of electoral votes in that election.
In the elections during and immediately after the US Civil War, we also see some states whose electoral votes for president are not counted (shown in purple). Wyoming, the state with the lowest population in the US, has the highest number of electoral votes per person in the state, while the three most populous states, California, Florida and Texas have the least number of electoral votes per person. Wyoming has four times the number of electors per capita than these 3 states have (i.e. accounting for their population sizes). That will be the subject of another map dataviz.
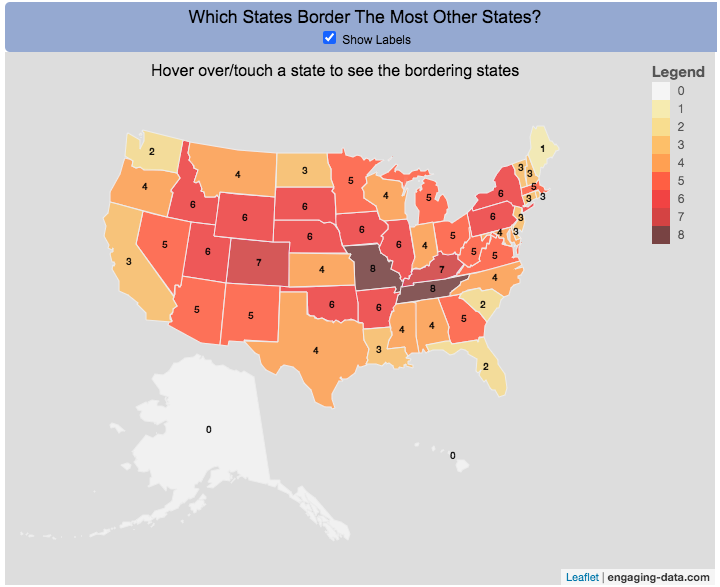
Interactive Choropleth of the Number of States That Border Each State
This is a fun little map that shows the number of states that border each state. I’m working on improving the interactivity of maps and this was a good project to try this with. The base map is a choropleth map which color codes each state by the number of states it shares a border with. If you hover over (or touch on mobile) a state, it will highlight the state and show you (and list) the bordering states.
It’s important to note that officially New York and Rhode Island share a water border (between Rhode Island and Long Island, NY) and that Michigan and Minnesota also share a border (in Lake Superior).
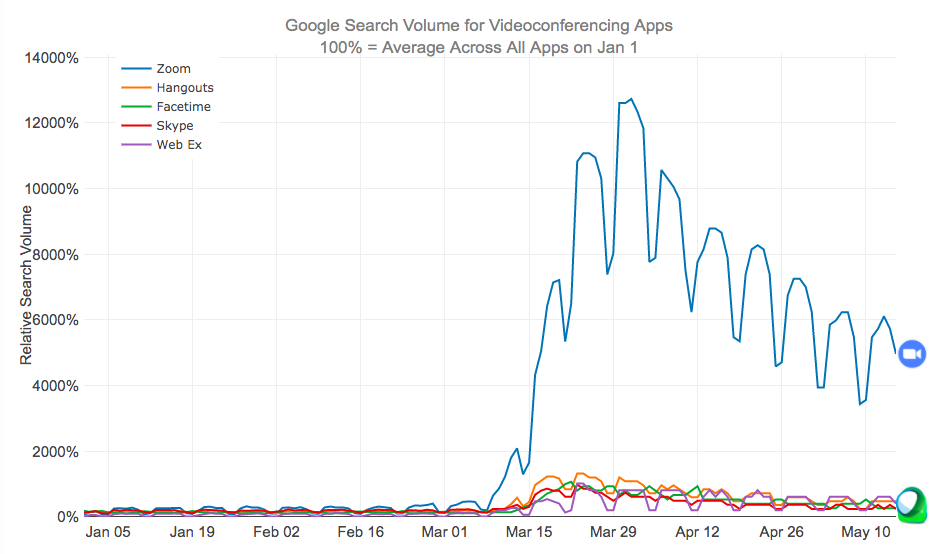
Zoom has become the primary video conferencing app over the last few months as schools and workplaces increasingly turned to remote learning and meetings.
Since the shelter-in-place orders across the United States due to the coronavirus in early to mid-March, many things have changed about our daily lives. One of the main ones is that schooling and work is being done remotely through video conferencing apps on our computers, tablets and smartphones. Our kids have zoom meetings with their teachers, parents have zoom meetings with our work colleagues and we all have facetime and google hangouts chats with our friends and family.
I remembered just a few year ago Skype was a very popular app to use for video chats, so I wanted to see how Zoom came to be the most popular app. The animated graph above shows the relative search volumes for 5 popular video conferencing apps from January 1 to May 15th (before and during the coronavirus restrictions on travel and gatherings).
This article implies that the reason Zoom had taken over so much is because it is free and easy to use for consumers. Even my tech-challenged mother is doing zoom calls for friends and classes.
Data and Tools:
Data is from google trends analysis of videoconferencing apps. Data is processed in javascript and graphed using the plotly open source graphing library.
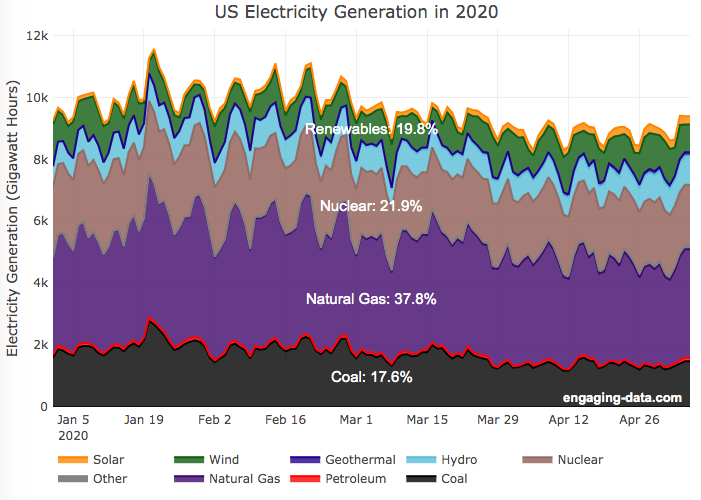
A remarkable thing is happening in the United States and in other places around the world. Partly due to the coronavirus pandemic and partly due to changes in natural gas and renewable energy prices, renewable electricity is now a larger fraction of the US electricity grid than coal. As of early May 2020, the fraction of coal generation of US electricity is about 18% while renewables (hydroelectric, wind, solar and geothermal) account for nearly 20%.
For the entire year of 2019, coal accounted for about 24.2% of US electricity generation, while renewables accounted for 17%.4. And in 2018, coal was 28.4% and renewables were 16.8%. When you include nuclear (not technically a renewable resource, but zero emissions of greenhouse gases), about 42% of US electricity generation in 2020 comes from zero carbon sources, while fossil fuels make up the remaining 68%.
This is good news because renewables produce little to no pollution that contributes to urban air quality, health issues and climate change. Coal is by far the worst electricity generation source when it comes to air pollution that impacts human health and climate change. So this shift away from coal and towards renewables is very good news.
Here’s the same graph but showing instead the fraction of electricity from each source (you can hover over the graph to get daily values).


Recent Comments