This is one of an ongoing series of visualizations about the state of California. This one is about the state’s economy, which recently moved into 4th place (2024), if California were its own country. It is, however, still part of the United States.
The visualization shows the relative sizes of the top 10 world economies (including the US, with California removed for context). California has the smallest population of any of the top 10, with #9 Canada just barely larger than California in population, though with a significantly smaller sized economy (about 1/2 the size).
Hover over the countries to see their GDP and population. California is behind the United States, China and Germany in total economic output (in nominal terms), but ahead of much larger countries Japan and India and the United Kingdom.
The state’s economy produces $4.1 Trillion dollars of economic output, driven by a range of industries including technology, real estate, manufacturing, agriculture and health care. It is a hub for innovation and entrepreneurship. California is also the leading agricultural state in the United States. Immigration is a huge part of the state’s workforce.
Sources and Tools:
2024 economic data was downloaded from the International Monetary Fund (IMF). This visualization is made using d3.js, an open-source javascript visualization library.
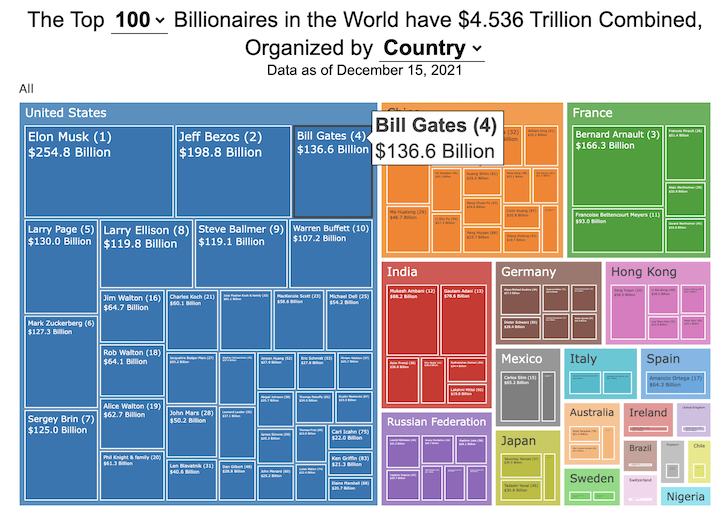
This dataviz compares how rich the world’s top billionaires are, showing their wealth as a treemap. The treemap is used to show the relative size of their wealth as boxes and is organized in order from largest to smallest.
User controls let you change the number of billionaires shown on the graph as well as group each person by their country or industry. If you group by country or industry, you can also click on a specific grouping to isolate that group and zoom in to see the contents more clearly. Hovering over each of the boxes (especially the smaller ones) will give you a popup that lets you see their name, ranking and net worth more clearly.
The popup shows how much total wealth the top billionaires control and for context compare it to the wealth of a certain number of households in the US. The comparison isn’t ideal as many of the billionaires are not from the US, but I think it still provides a useful point of comparison.
This visualization uses the same data that I needed in order to create my “How Rich is Elon Musk?” visualization. Since I had all this data, I figured I could crank out another related graph.
See all 339 Olympic Events in the Tokyo 2020/2021 Olympics
It had always seemed like the most decorated US Olympians tended to be swimmers, so I wanted to see how all the various events are distributed across the different types of sports. Each sport (like swimming) has a number of individual events and are show in a treemap as a collection of boxes. And indeed swimming does have the most individual events of any of the sports in the 2020/2021 Olympics.
I also wanted to see how you can categorize the different Olympic events, so I looked at several different dimensions, which are color coded:
Athlete Gender – Events are categorized into Men’s, Women’s, Mixed and Open Events. Mixed is when a specified number of Men and Women are in an event (i.e. one man and one woman) while Open events can be either Men or Women.
Team vs Individual – Events are categorized into whether the competitors are individuals or a team (more than one individual)
Competition Type – Events are categorized into the type of competition, such as a Race (competitors are performing simultaneously to see who finishes first), Individual (where the competitor performs the event by themselves), Opponent (where the competition is one opponent vs another) or Mixed (where there’s some combination of these types)
How winner are Determined – Events are categorized by the type of scoring: Timed (including all races), Judged, Scored (either in ball sports such as soccer or tennis, or in fighting sports like boxing and wrestling), Completion (where each competitor attempts to complete a jump or lift and the winner is the one who can complete the highest level), Distance (jumping and throwing events) and Hybrid (a combination of these types).
The sports with the largest number of individual events is swimming, then track, cycling, and field. Some the fighting sports have many individual events but they are all exclusive categories (i.e. you can’t compete in two different boxing or wrestling events).
Sources and Tools:
I grabbed a list of Olympic sports from Wikipedia and manually coded the information about gender, competition type and other factors. The visualization uses the plotly.js open source graphing library and HTML/CSS/Javascript code for the interactivity and UI.
See which words follow and break the “i before e” rule
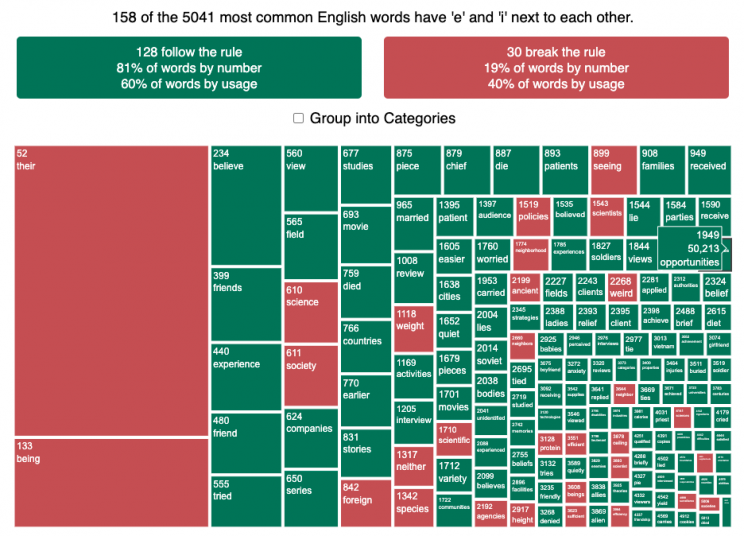
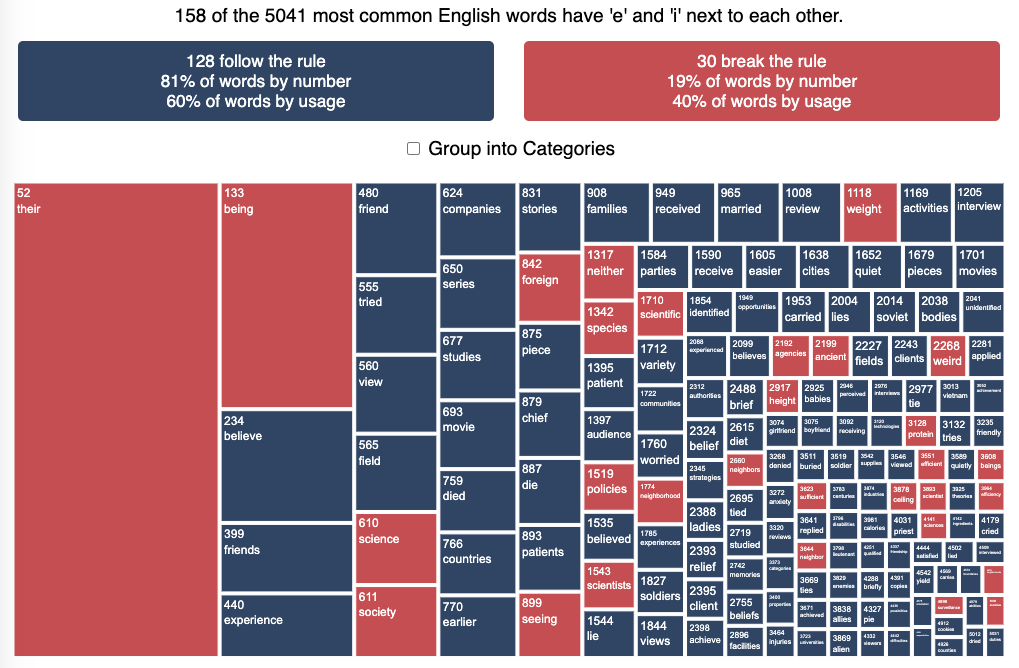
I wanted to see how often there were exceptions to the spelling rule “i before e, except after c”. I found a website (wordfrequency.info) that had a list of the 5050 most common english words and decided to do some analysis on it to see which words followed this rule and which did not. Below is a treemap graph that shows the words that follow the rule in green and those that do not in red. The size of the box represents how common the word is in regular American English usage (based on the frequency that it shows up in the Corpus of Contemporary American English).
What we see is that while 81% of the 158 most common words with ‘e’ and ‘i’ adjacent to one another do follow the rule, when you take into account how frequently these words are used, the weighted percentage of words following the rule drops to around 60%. This is because some very commonly used words do not follow this rule and if you were to count how many times you use words from this list, it’s likely that about 40% of the time you’ll be using words that don’t follow the rule. For example, the two most commonly used words with ‘e’ and ‘i’ adjacent (their and being) do not follow the rule, since then have the ‘e’ before the ‘i’ but aren’t after a ‘c’.
I was inspired to look into this after seeing a tweet about the rule in the comic Pearls before Swine by @stephanpastis.
I asked my kids but they had never heard of the rule so perhaps this isn’t taught in schools anymore.
Sources and Tools:
I downloaded the word list from wordfrequency.info. The wordlist comes from the Corpus of Contemporary American English (COCA), a collection of English works across a wide variety of genres (spoken, fiction, popular magazines, newspapers, academic texts, and TV and Movies subtitles, blogs, and other web pages between 1990 and 2020). This word list was then analyzed using javascript to categorize the word as fitting or breaking the rule. The visualization uses the plotly.js open source graphing library and HTML/CSS/Javascript code for the interactivity and UI.
Each state has two senators in the Senate, even though there is a great disparity in the populations of the states. This was a compromise that the framers of the Constitution dealt with in creating the framework of the US government. While the US House of Representatives is based on proportional representation, the Senate was designed to have two senators per state regardless of population. This leads to some interesting variations in the number of votes that some senators get relative to other senators (and how many people they represent).
Graph of Total Votes for Each Current Senator (2014, 2016 and 2018)
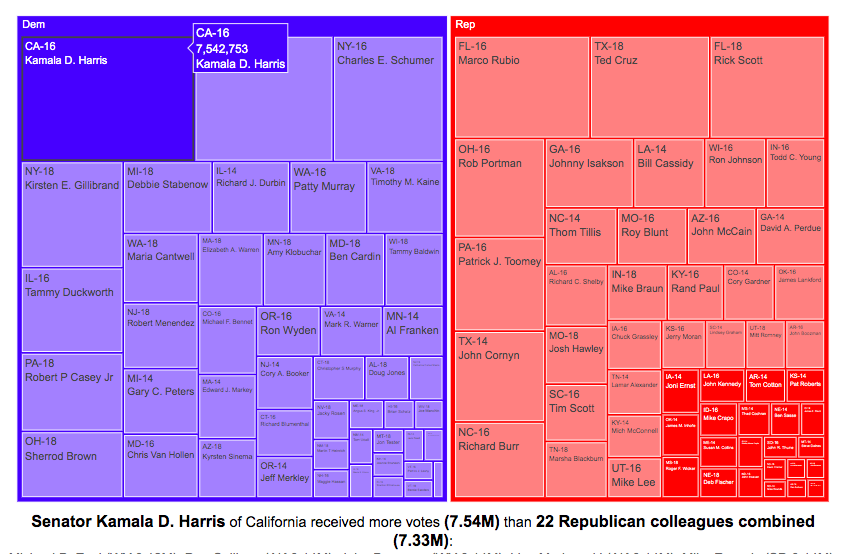
This graph is called a treemap and shows the total number of votes cast for the winner of each senate race of the current sitting senators. They are shown in order from largest to smallest vote totals, where the area of the rectangle is proportional to the number of votes. The treemap can be organized by party if desired. This graph does not show the number of votes that their opponents got.
If you hover over (click, on mobile) one of the boxes in the treemap, you can compare the number of votes received by that senator to the number of senators that received the same number of votes combined. This helps highlight the disparities in the representation of voters in large states in the Senate relative to that of voters in states with low populations.
For example, Kamala Harris, Democratic senator of my home state of California, received 7.5 million votes when she won her senate race in 2016. This large number of votes is larger than the combined votes for 22 of her Republican colleagues in small states. This is even more impressive since, as noted before, she ran against another Democrat Loretta Sanchez, in the election.
Note that some of the recently elected senators shown in the table are no longer serving in the Senate:
John McCain’s seat is currently held by Martha McSally
Johnny Isakson’s seat is currently held by Kelly Loeffler
Because of the large variation in population sizes and a tendency for more populous states to vote for democrats, Democratic Senators received many more votes in their elections than their Republican colleagues did, despite having fewer numbers. The 47 Democratic (and Independent) senators received a total of 67.5 million votes while the 53 Republican senators received 59.5 million votes.
Graph of Margin of Victory over Opposing Party for Each Current Senator (2014, 2016 and 2018)
This graph shows a slightly different set of data. Instead of total votes for the winning candidate, it shows the vote margin (i.e. the number of votes the winner received vs the opponent of a different party). The reason I specify it this way is that the two Democratic California senators defeated other democrats to win their elections (i.e. no republican was on the ballot in the general election because no republican got enough votes in the primary). This comparison is interesting because not only do some senators receive very few votes (because they live in small states), but they may only win by a small margin over their opponents. Comparing margins of victory, shows how few votes it would take to “flip” a Senate seat between the two parties.
If you take Kamala Harris’s margin of victory over Republicans to be her vote total (7.5 million votes) since there was no Republican running against her, her margin of victory is greater than the margin of victory of 43 of her Republican Senate colleagues combined.


Recent Comments