Posts for Tag: seasons
Visualizing the Variation in Sunlight by Latitude and Time of Year

How does the Earth’s tilt affect sunlight and seasons by latitude?
This visualization looks at the variation in the amount of sunlight different latitudes receive over the different days of the year. The amount of sunlight can be classified in 3 different categories:
- The number of hours of sunlight received each day
- The average sunlight intensity (in watts per square meter)
- The total amount of sunlight received across an entire latitude band (in gigawatt hours)
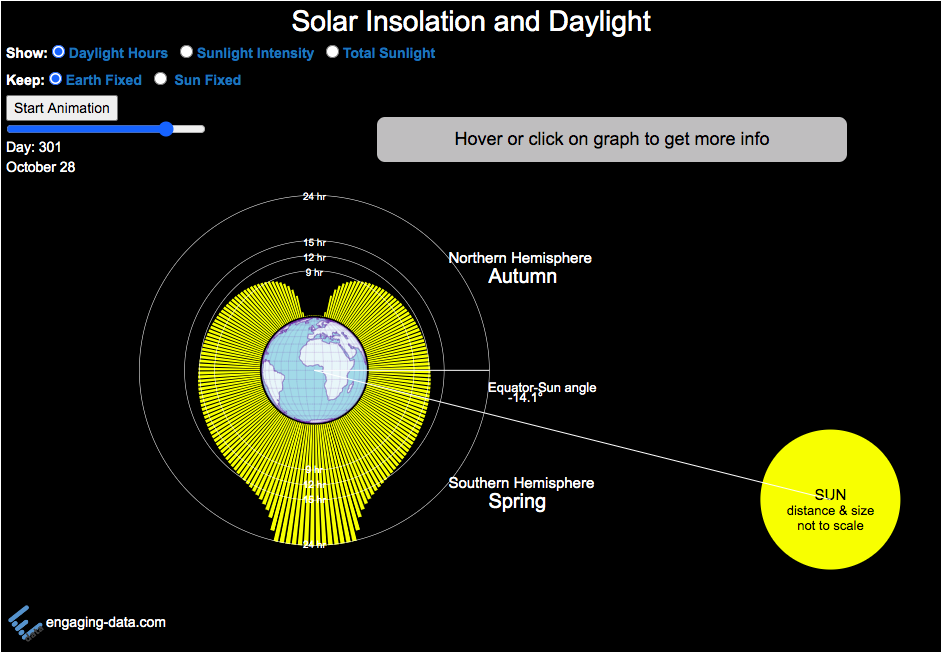
The default view is to see the number of hours of sunlight received by latitude on the current date, shown by the yellow bars. The sunlight hours range from 0 to 24 hours per day while most latitudes range from 9 to 15 hours.
If you hover over the yellow bars (or click on mobile), you will see the exact number of hours for that latitude band for that date.
Pressing the ‘Start Animation’ button, will change the angle of the sun relative to the Earth (as the earth rotates around the sun) and change the distribution of sunlight across the globe. You can view this animation with the earth fixed and the sun angle changing (the default view) or with the sun location fixed and the earth’s tilt changing.
This visualization helps to show how the seasons come about. When the Northern Hemisphere is tilted towards the sun, the amount of sunlight it receives increases (hours of daylight, average sun intensity and total amount of sunlight received). As the hemisphere tilts away from the sun, the amount of sunlight it receives decreases. The amount of sunlight a region receives causes the seasons that we experience.
Interestingly, when you are at the equator, the amount of sunlight per day does not really vary too significantly over the course of the year, whereas if you are near the poles, the difference between summer and winter is very dramatic. When looking at total sunlight received, the poles generally have lower sunlight because even in their summer, there is much lower land area relative to the middle latitudes (close to the equator)
The second visualization shown here shows how the tilt of the Earth’s axis is changed over the course of the Earth’s revolution around the sun. The Earth’s axis is tilted at 23.5 degrees relative to the plane of the Earth’s orbit around the sun. Like the last visualization, you can look at Earth the way we normally do (without the tilted axis) or from the perspective of the sun (with a tilted axis). This makes it a bit clearer why the tilt of the Earth’s axis can change from the north pole angled away to angled towards the sun.
Sources and Tools:
The equations for average daily solar insolation come from online lecture notes from University of Albany. The equations for number of hours of daylight comes from Wikipedia. The visualizations are made using the javascript d3 data visualization library and the interface and animation are made using javascript.
Visualizing the Variation in Sunlight by Latitude and Time of Year
How does the Earth’s tilt affect sunlight and seasons by latitude?
This visualization looks at the variation in the amount of sunlight different latitudes receive over the different days of the year. The amount of sunlight can be classified in 3 different categories:
- The number of hours of sunlight received each day
- The average sunlight intensity (in watts per square meter)
- The total amount of sunlight received across an entire latitude band (in gigawatt hours)
The default view is to see the number of hours of sunlight received by latitude on the current date, shown by the yellow bars. The sunlight hours range from 0 to 24 hours per day while most latitudes range from 9 to 15 hours.
If you hover over the yellow bars (or click on mobile), you will see the exact number of hours for that latitude band for that date.
Pressing the ‘Start Animation’ button, will change the angle of the sun relative to the Earth (as the earth rotates around the sun) and change the distribution of sunlight across the globe. You can view this animation with the earth fixed and the sun angle changing (the default view) or with the sun location fixed and the earth’s tilt changing.
This visualization helps to show how the seasons come about. When the Northern Hemisphere is tilted towards the sun, the amount of sunlight it receives increases (hours of daylight, average sun intensity and total amount of sunlight received). As the hemisphere tilts away from the sun, the amount of sunlight it receives decreases. The amount of sunlight a region receives causes the seasons that we experience.
Interestingly, when you are at the equator, the amount of sunlight per day does not really vary too significantly over the course of the year, whereas if you are near the poles, the difference between summer and winter is very dramatic. When looking at total sunlight received, the poles generally have lower sunlight because even in their summer, there is much lower land area relative to the middle latitudes (close to the equator)
The second visualization shown here shows how the tilt of the Earth’s axis is changed over the course of the Earth’s revolution around the sun. The Earth’s axis is tilted at 23.5 degrees relative to the plane of the Earth’s orbit around the sun. Like the last visualization, you can look at Earth the way we normally do (without the tilted axis) or from the perspective of the sun (with a tilted axis). This makes it a bit clearer why the tilt of the Earth’s axis can change from the north pole angled away to angled towards the sun.
Sources and Tools:
The equations for average daily solar insolation come from online lecture notes from University of Albany. The equations for number of hours of daylight comes from Wikipedia. The visualizations are made using the javascript d3 data visualization library and the interface and animation are made using javascript.
Recent Comments