Posts for Tag: Olympics
Visualizing Olympic Sports
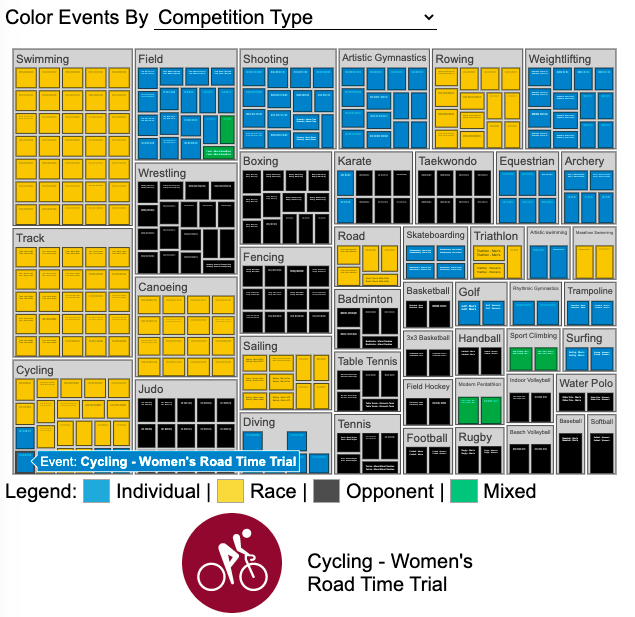
See all 339 Olympic Events in the Tokyo 2020/2021 Olympics
It had always seemed like the most decorated US Olympians tended to be swimmers, so I wanted to see how all the various events are distributed across the different types of sports. Each sport (like swimming) has a number of individual events and are show in a treemap as a collection of boxes. And indeed swimming does have the most individual events of any of the sports in the 2020/2021 Olympics.
I also wanted to see how you can categorize the different Olympic events, so I looked at several different dimensions, which are color coded:
- Athlete Gender – Events are categorized into Men’s, Women’s, Mixed and Open Events. Mixed is when a specified number of Men and Women are in an event (i.e. one man and one woman) while Open events can be either Men or Women.
- Team vs Individual – Events are categorized into whether the competitors are individuals or a team (more than one individual)
- Competition Type – Events are categorized into the type of competition, such as a Race (competitors are performing simultaneously to see who finishes first), Individual (where the competitor performs the event by themselves), Opponent (where the competition is one opponent vs another) or Mixed (where there’s some combination of these types)
- How winner are Determined – Events are categorized by the type of scoring: Timed (including all races), Judged, Scored (either in ball sports such as soccer or tennis, or in fighting sports like boxing and wrestling), Completion (where each competitor attempts to complete a jump or lift and the winner is the one who can complete the highest level), Distance (jumping and throwing events) and Hybrid (a combination of these types).
The sports with the largest number of individual events is swimming, then track, cycling, and field. Some the fighting sports have many individual events but they are all exclusive categories (i.e. you can’t compete in two different boxing or wrestling events).
Sources and Tools:
I grabbed a list of Olympic sports from Wikipedia and manually coded the information about gender, competition type and other factors. The visualization uses the plotly.js open source graphing library and HTML/CSS/Javascript code for the interactivity and UI.

Visualizing Olympic Sports
See all 339 Olympic Events in the Tokyo 2020/2021 Olympics
It had always seemed like the most decorated US Olympians tended to be swimmers, so I wanted to see how all the various events are distributed across the different types of sports. Each sport (like swimming) has a number of individual events and are show in a treemap as a collection of boxes. And indeed swimming does have the most individual events of any of the sports in the 2020/2021 Olympics.
I also wanted to see how you can categorize the different Olympic events, so I looked at several different dimensions, which are color coded:
- Athlete Gender – Events are categorized into Men’s, Women’s, Mixed and Open Events. Mixed is when a specified number of Men and Women are in an event (i.e. one man and one woman) while Open events can be either Men or Women.
- Team vs Individual – Events are categorized into whether the competitors are individuals or a team (more than one individual)
- Competition Type – Events are categorized into the type of competition, such as a Race (competitors are performing simultaneously to see who finishes first), Individual (where the competitor performs the event by themselves), Opponent (where the competition is one opponent vs another) or Mixed (where there’s some combination of these types)
- How winner are Determined – Events are categorized by the type of scoring: Timed (including all races), Judged, Scored (either in ball sports such as soccer or tennis, or in fighting sports like boxing and wrestling), Completion (where each competitor attempts to complete a jump or lift and the winner is the one who can complete the highest level), Distance (jumping and throwing events) and Hybrid (a combination of these types).
The sports with the largest number of individual events is swimming, then track, cycling, and field. Some the fighting sports have many individual events but they are all exclusive categories (i.e. you can’t compete in two different boxing or wrestling events).
Sources and Tools:
I grabbed a list of Olympic sports from Wikipedia and manually coded the information about gender, competition type and other factors. The visualization uses the plotly.js open source graphing library and HTML/CSS/Javascript code for the interactivity and UI.
Recent Comments