Posts for Tag: contour
How much will masks reduce coronavirus transmission rate R0?
It depends on their effectiveness and how many people wear them
R0 is the transmission rate which is defined as the average number of cases that are expected to be produced from a single case in an uninfected population. R0 is dependent on a number of different factors that include transmissibility of a disease (how infectious it is), the amount of social contact and the duration of social contact. We have learned that variants of the coronavirus (such as delta or omicron) can greatly influence the transmissibility of the disease.
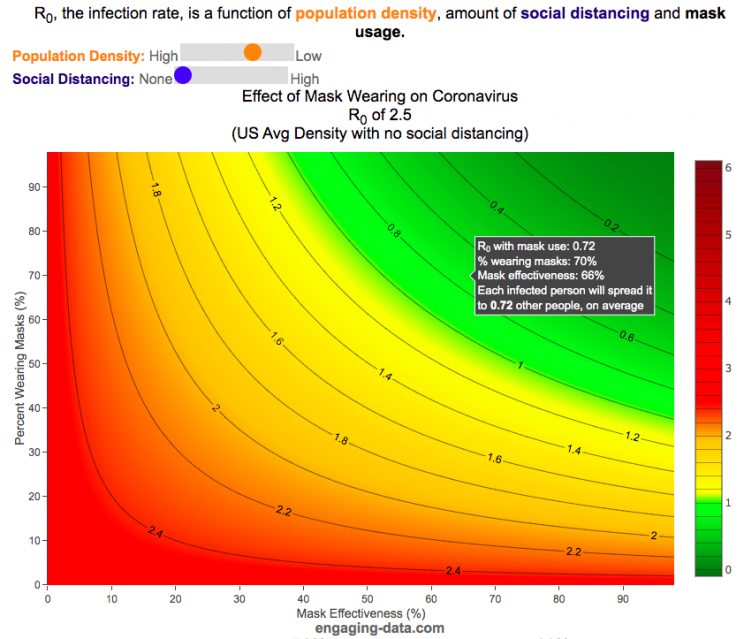
A baseline level of social contact is related to the population density (how often you come into contact with other people) and social distancing (limiting gatherings, not going in to work or school, etc) will reduce the amount of social contact with different people. Given what we know about coronavirus and its transmission, the amount of “contact” can also be influenced by mask wearing. This interactive graph shows the effect of mask wearing and effectiveness on reducing R0 even further. Because the effectiveness of existing vaccines is as of yet unknown against Omicron, this visualization does not take into account vaccines and their effectiveness of reducing R0, which is a very important limitation.
A very important caveat to this visualization: This visualization was initially created before COVID-19 vaccines were available and does not currently take their ability to prevent infection (and lower R0) into account because the effectiveness of each vaccines differs and the protection against infection wanes over time
This graph is a work-in-progress so please feel free to provide suggestions and feedback on issues of scientific concepts as well as for improvements in conveying the concepts/ideas.
Methodology
R0 values for different regions and population densities are estimated from Youyang Gu’s machine learning model for spread in Feb and early-March (i.e. before social distancing and mask wearing).
Baseline R0,variant based on variant transmissibility – R0 value ranges from an early estimate of 8 for Omicron to 5 for Delta and 2.5 for the original Alpha strain.
Population density factor (PDF) – this can increase or decrease the R0 value based on how much close contact you have. It ranges from about 2.4 in very high density places like New York City with lots of transit use where you are in close contact with other people for long periods of time to 0.8 in rural areas with much less contact. A value of 1 represents average US population density.
Social distancing factor (SDF) – this is simply a reduction on the baseline R0 based on the amount of social distancing (ranges from 100% (no social distancing) to 33% (high levels of social distancing). This is a reduction in the amount of time and number of people the average person is exposed to compared to baseline levels.
Mask effectiveness (Kmaskeff) – is defined as the percentage reduction in transmission of coronavirus that mask wearing can provide. An N95 mask is at least 95% effective at blocking most particles, but because it also reduces the speed at which your exhalation can travel outward (providing more time for droplets and aerosols to spread and diffuse to low concentration), an N95 can be much more than 95% effective in reducing coronavirus droplet and aerosol spread compared to the unmasked case. I’ve seen estimates for things like bandanas and homemade cloth mask having lower effectiveness maybe around 50% but I don’t know how scientifically they were estimated/calculated. Also depending on how mask are worn, this can also affect the effectiveness parameter. For example if an N95 mask does not fit tightly against the face and there are large gaps for air to flow, this will reduce the effectiveness of the mask. This parameter is shown on the x-axis.
Percent wearing masks (Kmaskfreq) – is simply the percentage of people wearing masks (varies from 0% to 100%). This parameter is shown on the y-axis.
The formula for effective Reffective is:
$R_\mathit{eff}=R_0,variant \times PDF \times SDF \times (1-K_{mask\mathit{eff}} \times K_{maskfreq})^2$
where $R_\mathit{eff}$ is the final average transmission value, $R_0,variant$ is the $R_0$ value based on the coronavirus variant type, PDF is the population density factor, SDF is the social distancing factor, $K_{mask\mathit{eff}}$ is the average mask effectiveness and $K_{maskfreq}$ is the percentage of people wearing masks. The squared parameter on the right side of the equation is essentially the average reduction in transmission that is likely due to mask usage and is from a preprint from Howard et al.
As you move up and to the right of the graph, mask use and effectiveness become very high and the transmission of coronavirus declines significantly. If you hover over the graph (on a desktop) or click on the graph (on mobile) you will see a popup that shows the Reff value that results. The lower the Reff value is the better as it dramatically affects the rate of transmission. High numbers will lead to explosive exponential growth while values below 1.0 will eventually reduce coronavirus transmissions to near 0.
For example at R0 of 6 and no social distancing or mask usage, one initial case can lead to approximately 56,000 cases in only 30 days. Whereas an Reff of 0.5 will only lead to a total of ~1 additional case in 30 days.
I am not an epidemiologist so some of the linear relationships and assumptions may be incorrect. Please let me know if I got anything terribly wrong or if you have any questions or suggestions on how the tool works, is structured or presented.
Source and Tools:
The reduction in R0 due to mask effectiveness and usage based on a model from a preprint from Howard et al. Baseline R0 are from Youyang Gu’s machine learning model. Calculations are done in javascript and visualization is done with the open source Plotly javascript graphing library.

How much will masks reduce coronavirus transmission rate R0?
It depends on their effectiveness and how many people wear them
R0 is the transmission rate which is defined as the average number of cases that are expected to be produced from a single case in an uninfected population. R0 is dependent on a number of different factors that include transmissibility of a disease (how infectious it is), the amount of social contact and the duration of social contact. We have learned that variants of the coronavirus (such as delta or omicron) can greatly influence the transmissibility of the disease.
A baseline level of social contact is related to the population density (how often you come into contact with other people) and social distancing (limiting gatherings, not going in to work or school, etc) will reduce the amount of social contact with different people. Given what we know about coronavirus and its transmission, the amount of “contact” can also be influenced by mask wearing. This interactive graph shows the effect of mask wearing and effectiveness on reducing R0 even further. Because the effectiveness of existing vaccines is as of yet unknown against Omicron, this visualization does not take into account vaccines and their effectiveness of reducing R0, which is a very important limitation.
A very important caveat to this visualization: This visualization was initially created before COVID-19 vaccines were available and does not currently take their ability to prevent infection (and lower R0) into account because the effectiveness of each vaccines differs and the protection against infection wanes over time
This graph is a work-in-progress so please feel free to provide suggestions and feedback on issues of scientific concepts as well as for improvements in conveying the concepts/ideas.
Methodology
R0 values for different regions and population densities are estimated from Youyang Gu’s machine learning model for spread in Feb and early-March (i.e. before social distancing and mask wearing).
Baseline R0,variant based on variant transmissibility – R0 value ranges from an early estimate of 8 for Omicron to 5 for Delta and 2.5 for the original Alpha strain.
Population density factor (PDF) – this can increase or decrease the R0 value based on how much close contact you have. It ranges from about 2.4 in very high density places like New York City with lots of transit use where you are in close contact with other people for long periods of time to 0.8 in rural areas with much less contact. A value of 1 represents average US population density.
Social distancing factor (SDF) – this is simply a reduction on the baseline R0 based on the amount of social distancing (ranges from 100% (no social distancing) to 33% (high levels of social distancing). This is a reduction in the amount of time and number of people the average person is exposed to compared to baseline levels.
Mask effectiveness (Kmaskeff) – is defined as the percentage reduction in transmission of coronavirus that mask wearing can provide. An N95 mask is at least 95% effective at blocking most particles, but because it also reduces the speed at which your exhalation can travel outward (providing more time for droplets and aerosols to spread and diffuse to low concentration), an N95 can be much more than 95% effective in reducing coronavirus droplet and aerosol spread compared to the unmasked case. I’ve seen estimates for things like bandanas and homemade cloth mask having lower effectiveness maybe around 50% but I don’t know how scientifically they were estimated/calculated. Also depending on how mask are worn, this can also affect the effectiveness parameter. For example if an N95 mask does not fit tightly against the face and there are large gaps for air to flow, this will reduce the effectiveness of the mask. This parameter is shown on the x-axis.
Percent wearing masks (Kmaskfreq) – is simply the percentage of people wearing masks (varies from 0% to 100%). This parameter is shown on the y-axis.
The formula for effective Reffective is:
$R_\mathit{eff}=R_0,variant \times PDF \times SDF \times (1-K_{mask\mathit{eff}} \times K_{maskfreq})^2$
where $R_\mathit{eff}$ is the final average transmission value, $R_0,variant$ is the $R_0$ value based on the coronavirus variant type, PDF is the population density factor, SDF is the social distancing factor, $K_{mask\mathit{eff}}$ is the average mask effectiveness and $K_{maskfreq}$ is the percentage of people wearing masks. The squared parameter on the right side of the equation is essentially the average reduction in transmission that is likely due to mask usage and is from a preprint from Howard et al.
As you move up and to the right of the graph, mask use and effectiveness become very high and the transmission of coronavirus declines significantly. If you hover over the graph (on a desktop) or click on the graph (on mobile) you will see a popup that shows the Reff value that results. The lower the Reff value is the better as it dramatically affects the rate of transmission. High numbers will lead to explosive exponential growth while values below 1.0 will eventually reduce coronavirus transmissions to near 0.
For example at R0 of 6 and no social distancing or mask usage, one initial case can lead to approximately 56,000 cases in only 30 days. Whereas an Reff of 0.5 will only lead to a total of ~1 additional case in 30 days.
I am not an epidemiologist so some of the linear relationships and assumptions may be incorrect. Please let me know if I got anything terribly wrong or if you have any questions or suggestions on how the tool works, is structured or presented.
Source and Tools:
The reduction in R0 due to mask effectiveness and usage based on a model from a preprint from Howard et al. Baseline R0 are from Youyang Gu’s machine learning model. Calculations are done in javascript and visualization is done with the open source Plotly javascript graphing library.
Recent Comments