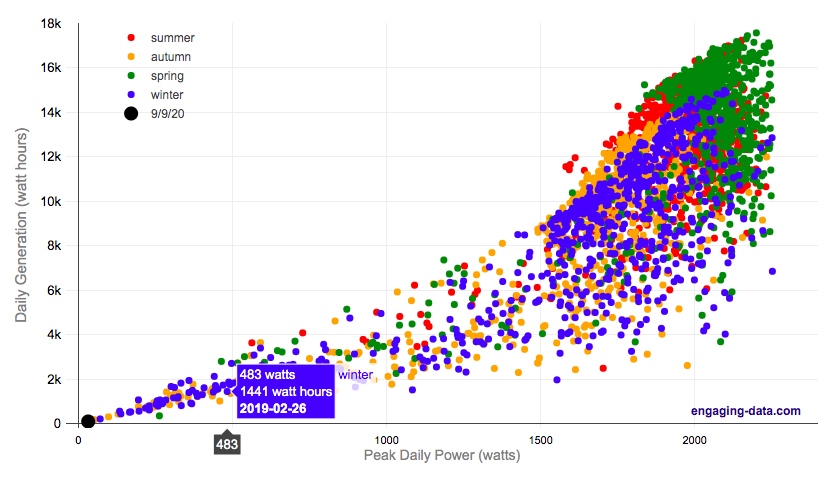
On September 9th, 2020, the entire San Francisco Bay Area, we had a crazy combination of wildfire smoke and low clouds that darkened the sky and turned everything orange. At 9am, it looked like it was nighttime and at noon, it was so dark, that it looked like dusk.
Here is a plot of 8+ years of solar panel generation from our panels. If you click on the legend, you can toggle whether that data is shown. Total generation for the day was only 93 watt hours (as opposed to a summer median of 13300 watt hours, 13.3 kWh) and peak power was only 32 watts (vs a median summer peak of 2000 watts (2.0 kW)).
The solar generation was even worse than the next worst day in winter (typically when it rains all day). Clicking on the legend will toggle whether certain seasons are shown and you can view how solar generation varies by season.
Here is a google image search of photos showing the crazy, apocalyptic scenes with the orange color.
Source and Tools:
Data on solar generation is downloaded from our solar panel inverter provider (enphase) and cleaned with a python script. Graph is made using the plotly open source javascript library.
No Comments »