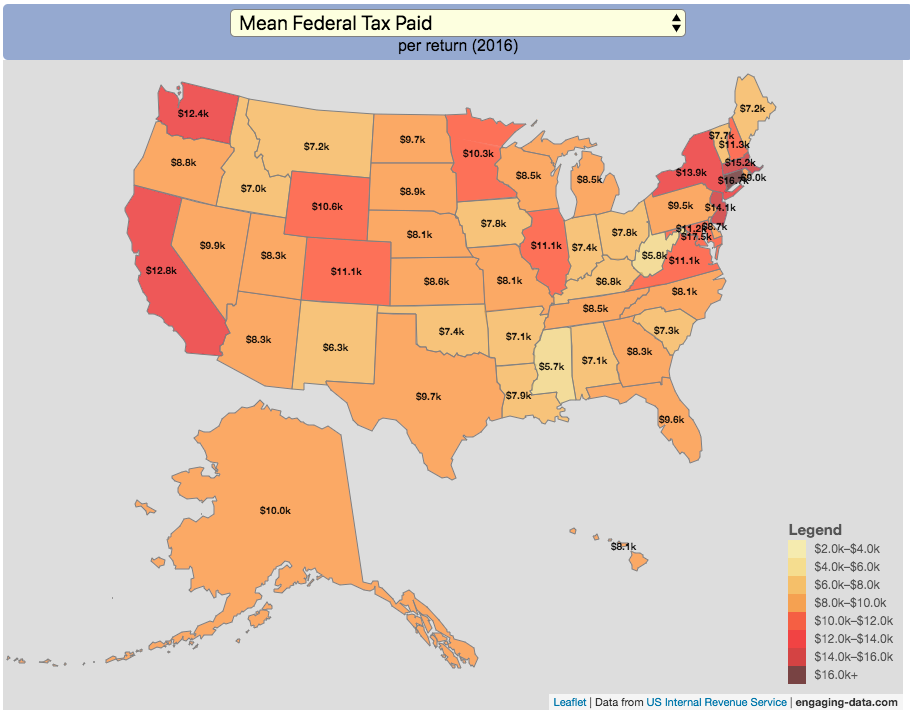
Given that tax day has just passed, I thought it would be good to check out some data on taxes. The IRS provides a great resource on tax data that I’ve only just gotten into. I think I’ll be able to do more with this in the future. This one looks at how taxes paid varies by state and presents it as a choropleth map (coloring states based on certain categories of tax data).
- Mean Federal Tax Paid
- Mean Adjusted Gross Income
- Mean State/Local Tax
- Mean Combined (Fed/State/Local) Tax
- Percent Income from Dividends and Capital Gains
- Percent of Returns with Itemized Deductions
- Number of Tax Returns
- Mean Federal Tax Rate
- Mean State/Local Tax Rate
- Mean Combined (Fed/State/Local) Rate
- Total Federal Tax Liability
I may add more categories in the future, so if you have ideas of tax data you want to see visualized let me know and I’ll see what I can do.
For other tax-related tools and visualizations see my tax bracket calculator and visualization of marginal tax rates.
**Click Here to view other financial-related tools and data visualizations from engaging-data**
Data and Tools:
Data on tax returns by state is from the IRS website in an excel format. The map was made using the leaflet open source mapping library. Data was compiled in excel and calculations made using javascript.


1 Comment »
One Response to How Much Does Each State Pay In Taxes?
Is there some way to see DC? It might be in there, but I cannot hover on it. I just see VA, MD, DE