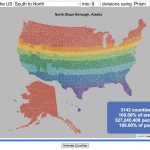
Watch the United States assemble state by state based on statistics of interest
Based on earlier popularity of the country-by-country animation, this map lets you watch as the world is built-up one state at a time. This can be done along a large range of statistical dimensions:
These statistics can be sorted from small to large or vice versa to get a view of the US and its constituent states plus DC in a unique and interesting way. It’s a bit hypnotic to watch as the states appear and add to the country one by one.
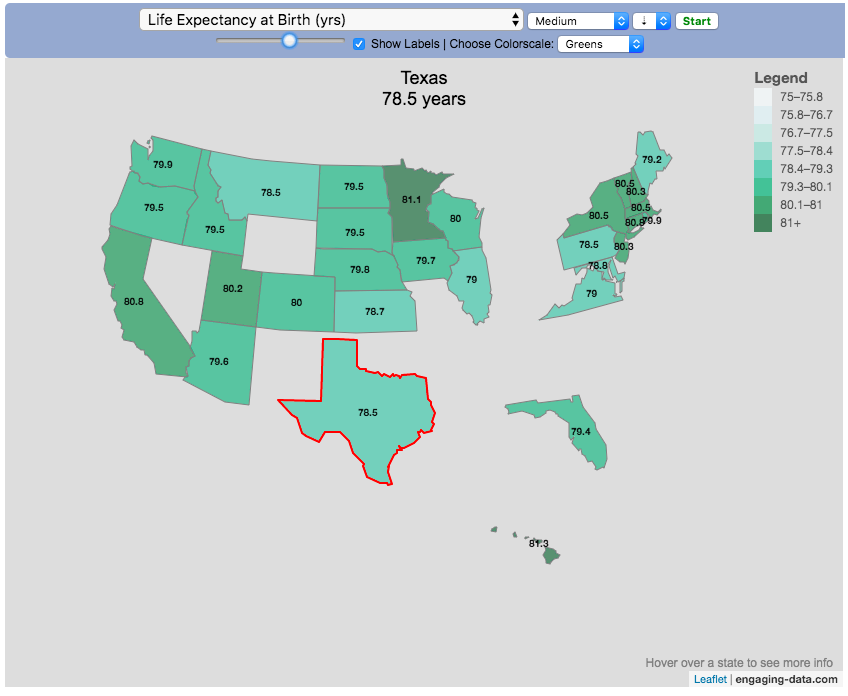
You can use this map to display all the states that have higher life expectancy than the Texas:
select “Life expectancy”, sort from “high to low” and use the scroll bar to move to the Texax and you’ll get a picture like this:
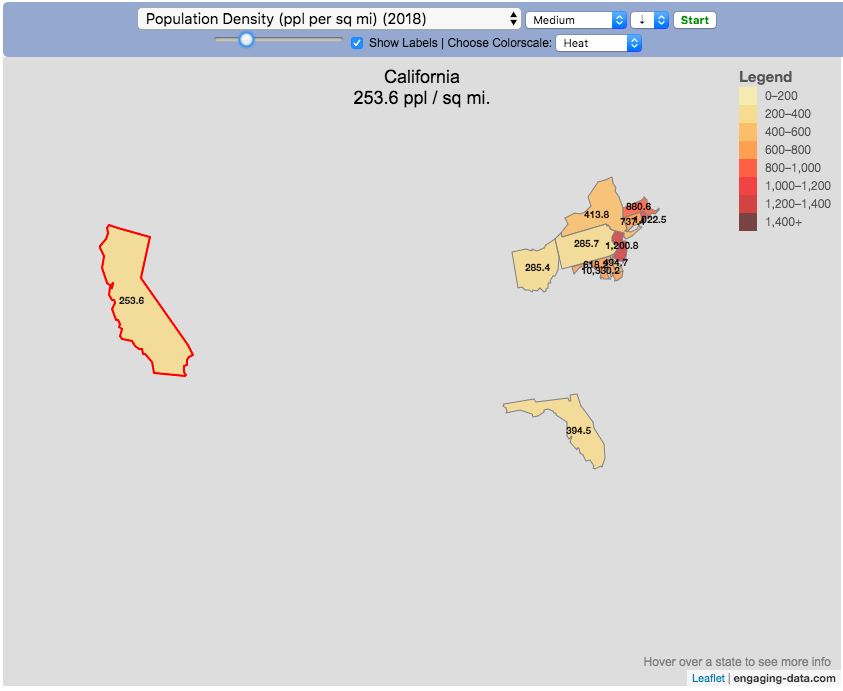
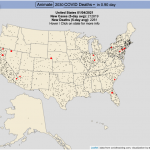
or this map to display all the states that have higher population density than California:
select “Population density, sort from “high to low” and use the scroll bar to move to the United States and you’ll get a picture like this:
I hope you enjoy exploring the United States through a number of different demographic, economic and physical characteristics through this data viz tool. And if you have ideas for other statistics to add, I will try to do so.
Data and tools: Data was downloaded from a variety of sources:
- Population https://en.wikipedia.org/wiki/List_of_states_and_territories_of_the_United_States_by_population
- Admission to union https://simple.wikipedia.org/wiki/List_of_U.S._states_by_date_of_admission_to_the_Union
- Educational attainment https://nces.ed.gov/programs/digest/d18/tables/dt18_104.88.asp
- Highest points https://geology.com/state-high-points.shtml
- Life expectancy https://en.wikipedia.org/wiki/List_of_U.S._states_and_territories_by_life_expectancy
- Median Age http://www.statemaster.com/graph/peo_med_age-people-median-age
- Land area https://statesymbolsusa.org/symbol-official-item/national-us/uncategorized/states-size
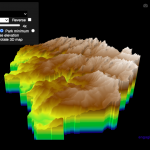
- Mean elevation https://www.census.gov/library/publications/2011/compendia/statab/131ed/geography-environment.html
- Electricity price https://www.chooseenergy.com/electricity-rates-by-state/
- Gasoline price https://gasprices.aaa.com/state-gas-price-averages/
- GDP https://www.bea.gov/data/gdp/gdp-state
- Sunlight North America Land Data Assimilation System (NLDAS) Daily Sunlight (insolation) for years 1979-2011 on CDC WONDER Online Database, released 2013. Accessed at http://wonder.cdc.gov/NASA-INSOLAR.html on Jun 14, 2019 1:37:15 PM
- Births United States Department of Health and Human Services (US DHHS), Centers for Disease Control and Prevention (CDC), National Center for Health Statistics (NCHS), Division of Vital Statistics, Natality public-use data 2007-2017, on CDC WONDER Online Database, October 2018. Accessed at http://wonder.cdc.gov/natality-current.html on Jun 14, 2019 1:53:58 PM
- Precipitation North America Land Data Assimilation System (NLDAS) Daily Precipitation for years 1979-2011 on CDC WONDER Online Database, released 2013. Accessed at http://wonder.cdc.gov/NASA-Precipitation.html on Jun 26, 2019 3:30:40 PM
- Temperature http://www.usa.com/rank/us–average-temperature–state-rank.htm
The map was created with the help of the open source leaflet javascript mapping library
1 Comment »
One Response to Assembling the USA state-by-state with state-level statistics
This is a nice visualization. I will suggest adding at least Puerto Rico.