If you need to register to vote, please visit Rock the Vote to get registered in your state.
US politics has more than a few issues, which have been highlighted by the current situation in Washington DC. The protests and greater political awareness from high school students and young adults is a positive sign for democracy, but it needs to be accompanied by increased rates of voting from this demographic. I thought it would be interesting to explore rates of voting in the US across different demographic groups (age, education, income, race). This data is from the 2016 US presidential election.
Total eligible US voting population was about 224 million in 2016 and the overall rate of voting among this population was 61.4%.
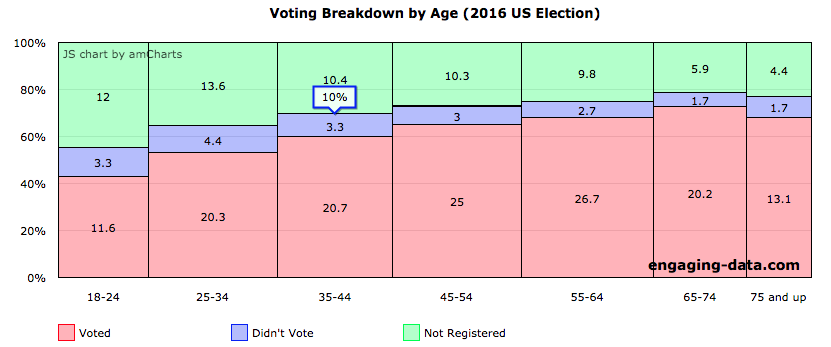
The first graph shows the distribution by age. As we can see, the rate of registration and voting increases with age. It is hard to engage young people to be interested in voting but hopefully they will do so in greater numbers this upcoming election.
The 2nd graph shows voting by race. There are important structural reasons why voting rates by minorities are lower, but again it is hoped that they will vote in increasing numbers in order to get their voices heard.
The last two graphs show voting by education level and household income. Again, we see those without economic and political power voting at much lower rates than those with power. One option I’ve heard is to make election day a national holiday which can help increase voting levels for the working class.
Disaggregating voting by looking at voting rates of specific demographic categories is helpful in identifying populations where we can try to improve voting rates (or identify barriers to voting among these groups).
I will revisit this data for the 2018 midterm elections. It is generally the case that without a presidential election, voting rates go down pretty significantly. We will see if discussions about empowering specific groups of voters (young and minority) and a wave of anti-Trump voting will lead to high levels of voting engagement.
Source and tools: The data comes from the US Census Bureau’s Voting and Registration Supplement to the Current Population Survey. Data was downloaded as excel tables and modified and then visualized with javascript Amcharts engine.
No Comments »