Posts for Tag: histogram
Should You Invest Or Wait When The Stock Market Is At An All-Time-High?
Whenever there’s been an extended bull run, one question that comes to mind “Should I invest in the market now, or wait until a pullback?” The question comes about because of fear and loss aversion: fear that the market will drop right after they invest and the observation that people want to avoid losses more than they value gains. However, historically, the correct answer, at least over the last 69 years, has been to invest and not to try to time the market.
This was also demonstrated in the Market Timing Game; that people are pretty bad at predicting the direction of the markets and given the upward trend of the market, it’s simpler and more likely than not, better to just stay invested in the market. The corollary to this is that when you have additional money to invest (e.g. from regular savings from your paycheck or a one-time event like the sale of a house), it makes sense to invest the money and not worry about whether the market is at a high or low point. Some graphs that look at the distribution of returns when the market is at an all time high (ATH) can help answer this question of whether you expect to see worse returns than investing at other times.
(more…)
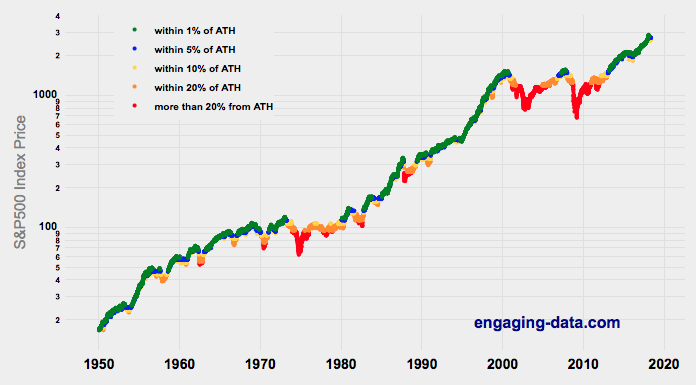
Recent Comments