Continuing on the theme of March Madness matchups, this page lets you create a bracket based on probabilities that are related to the tournament seeds issued by the committee. Seeds are supposed to be an indication of the relative strength of a team relative to other teams in this tournament, so that a 1 seed should be better than a 2 seed, etc…
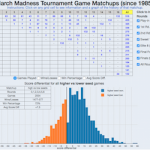
The bracket is generated by using data from tournament history (1985-2017) to look at the likely outcome of a given matchup between two specified seeds (1 vs 16, 2 vs 15, etc…). My March Madness Matchup Visualizer shows how frequently these specific matchups occur and their outcomes.
In some instances, there is no historical record for a given matchup (i.e. a 1 seed has never played a 14 seed). In these instances, which will only happen in later rounds of the tournament, I set the win probability for the higher seed (i.e. the one with the lower number) at 66% if the difference in seeding was 5 or greater (i.e. 8 vs 15 seed) and an even coin flip (50%) if the seeds were closer than that.
You can click the “Generate Picks” button a number of times to get different bracket outcomes and even download this as a CSV file if you want to save it and use it to fill out a bracket. These projections are meant to show probabilities of independent events (i.e. individual basketball games), and there is no one projected bracket that is more likely to be correct than a thousand other brackets, but the brackets generated here are at least consistent with historical outcomes.
Monte Carlo simulation
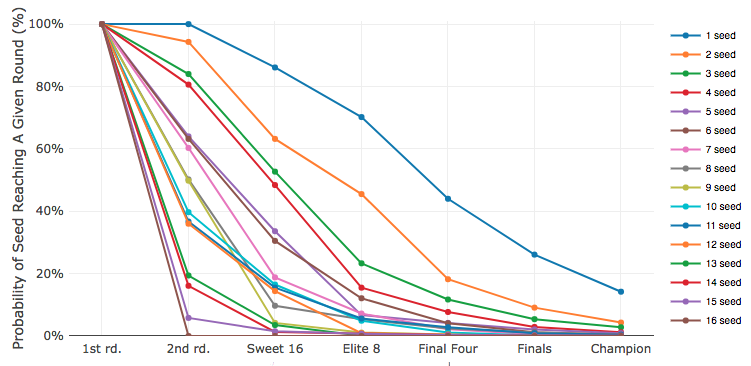
If you were to click on the “Generate Picks” button one thousand times, and note which seeds make it to certain rounds, you’ll sense a pattern that is consistent with their seeding. This is called a Monte Carlo simulation (where you make repeated probabilistic draws) and look at the aggregated outcomes. This is done for you by pushing the “Simulate 1000 Brackets” button below.
This shows that in 1000 runs of this bracket picking simulation, a given 1 seed has a probability of winning the tournament about 15% of the time (though any one seed winning is over 50% probable). You can see the probability of other seeds becoming champions or reaching specific rounds as well.
One interesting fact is shown in the sweet 16 round. A 9 seed has a much lower probability of reaching that round than a 10, 11 or 12 seed. This is because a 9 seed will have to face a 1 seed if it wins its first round match, while the 10-12 seeds would face lower seeds.
Good luck with your brackets and enjoy the tournament action and lots of upsets.
Disclaimer: I’m not responsible for you losing money in your office pool.
Data and Tools: programmed entirely in javascript, and historical game scores were downloaded from sports-reference.com.
No Comments »