Archives by Month: March 2016
How Fast Are California Reservoirs Filling Up?
Update: I added a date slider to let you scrub through dates as well as the ability to pause the animation.
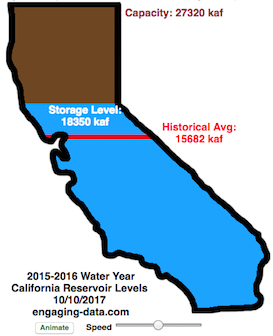
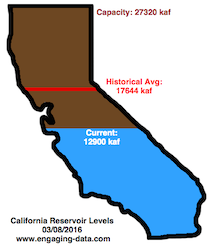
In my California water levels visualization, I presented a “bar graph” showing the amount of water currently in California’s reservoirs. However, I thought it’d be interesting to see how this has changed over the course of the last few months, since the state has gotten alot of rain and snow recently.
This visualizations “animates” the graph for recent history (going back to October 1, 2015) showing how the recent rains (or lack thereof) has been caused the levels of the reservoirs in California to rise (and fall).
The historical average represents a daily average reservoir level. It changes for each day of the water year to represent seasonality of precipitation and runoff.
Click the “animate” button below the figure and you can use the slider to change the speed of animation as it cycles through the days. I added a Date slider which lets you scrub through all the dates and animate from different points. (more…)
How Much Water is in California Reservoirs? – Current and Historical Visualization
**Check out the new reservoirs dashboard**
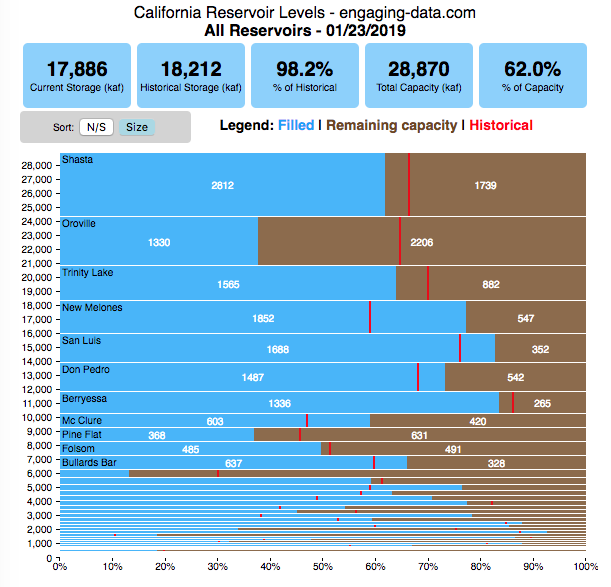
California has had an issue with drought, especially for the past few years now. Recently, 2016-2017’s El Nino weather patterns has brought a significant amount of rain to the state and helped alleviate some, but not all, of the major issues.
I’ve been very curious to understand how the rain storms we experience are lessening the impact of the drought, and whether one wet season (like 2016-2017) can really “get the state out of a drought”. One way to assess this is to look at the status of California reservoirs.
How Fast Are California Reservoirs Filling Up?
Update: I added a date slider to let you scrub through dates as well as the ability to pause the animation.
In my California water levels visualization, I presented a “bar graph” showing the amount of water currently in California’s reservoirs. However, I thought it’d be interesting to see how this has changed over the course of the last few months, since the state has gotten alot of rain and snow recently.
This visualizations “animates” the graph for recent history (going back to October 1, 2015) showing how the recent rains (or lack thereof) has been caused the levels of the reservoirs in California to rise (and fall).
The historical average represents a daily average reservoir level. It changes for each day of the water year to represent seasonality of precipitation and runoff.
Click the “animate” button below the figure and you can use the slider to change the speed of animation as it cycles through the days. I added a Date slider which lets you scrub through all the dates and animate from different points. (more…)
How Much Water is in California Reservoirs? – Current and Historical Visualization
**Check out the new reservoirs dashboard**
California has had an issue with drought, especially for the past few years now. Recently, 2016-2017’s El Nino weather patterns has brought a significant amount of rain to the state and helped alleviate some, but not all, of the major issues.
I’ve been very curious to understand how the rain storms we experience are lessening the impact of the drought, and whether one wet season (like 2016-2017) can really “get the state out of a drought”. One way to assess this is to look at the status of California reservoirs.
Recent Comments